2018 Stats and Facts of the American Mover

Colin Holmes
Dec 13, 2021
Icon Time To Read4 min read

Are you moving soon? You’re not alone. Roughly 35.5 million Americans move each year using everything from professional movers to old station wagons.1

But where are we moving? How far do we move? And what are the most common reasons for picking up and starting life in a new home? We’ve compiled a few interesting facts and statistics to answer these questions and give you some insight into how Americans are moving from A to B.

Moving Stats & Facts

Where are we moving?

In 2017, only 11% of the US population moved. This is the lowest moving rate since the Census Bureau began tracking it in 1948—a year which saw more than 20% of the population relocate.

Moving to a new home doesn’t always mean moving very far, though. Most movers never even leave their own county, let alone their own state. Here’s a breakdown:2

  • 62% of movers in 2017 remained in the same county after their move.
  • 34% of movers relocated to a different county (including same-state and different-state moves).
  • 4% of the moving population came from abroad.

Ready to move?

Company
Company type
Move.org rating
Packing & loading services
Pricing
Discounts
Learn more
Professional mover
4.8 out of 5 stars
4.8
Icon Yes  LightYes
$$$
Icon Yes  Light10% Move.org discount, military personnel, seniors
Professional mover
4.5 out of 5 stars
4.5
Icon Yes  LightYes
$$$
Icon No  LightNone
Professional mover
4.8 out of 5 stars
4.8
Icon Yes  LightYes
$$$
Icon Yes  LightSeniors
Moving container company
4.6 out of 5 stars
4.6
Icon No  LightNo
$$
Icon Yes  Light10% Move.org discount, military personnel
Moving container company
4.5 out of 5 stars
4.5
Icon No  LightNo
$$
Icon Yes  LightMove.org readers, military personnel

Top 10 states Americans are leaving

When we are compelled to move out of state, however, some states see more people departing their borders than coming in and settling down.

Here are the top ten states with a higher percentage of outbound moves than inbound moves:3

Top 10 States Americans Are Leaving

Top 10 states Americans are moving to

We all have grand dreams of moving to the coast or starting a new life in the big city, but you may be surprised to learn that only three states in the top ten have an ocean view and only one is home to a city with a population of more than 1 million people.

Here are the top ten states with a higher percentage of people moving in than moving out:4

Top 10 States American Are Moving To

Why are we moving?

When you move to a new city, one of the first questions people tend to ask is what brought you there. Did you move for work? Did you move to be closer to family? Did you move to get away from family? The reasons are endless.

Here are the top reasons people choose to move according to the most recent census data:5

Top 12 reasons Americans move


Who moves more often: owners or renters?

It shouldn’t come as a big surprise that renters hop from place to place a bit more often than owners. Leases only last so long and if you’re stuck in an apartment next to an aspiring accordion artist, you might not have too much incentive to renew.

Even though most renters don’t intend to stay in their apartments or homes for long, their moving rate has steadily declined over the last thirty years.6 Take a look at the numbers:

  • Only 21.7% of renters moved in 2017, compared to the 35.2% of renters who moved in 1988 when these numbers were first being tracked.
  • Owners are also staying put for longer periods of time. In 2017, only 5.5% of owners moved, while 1988 experienced an owner-mover rate almost twice as high at 9.5%.

How are we moving?

Professional moves vs. DIY moves

Everyone has their own reason for moving, but when it comes to choosing how you’re going to get your belongings to your new abode, there are only three real options: Hiring a professional moving company, renting a moving truck, or doing the whole thing yourself.

The American Moving and Storage Association (AMSA) broke down the data of 3 million interstate moves and here’s what it found about how Americans choose to move:7

How Are Americans Moving?

Hiring a professional mover? Odds are you may not have to pay

Whether you rent an apartment or own a luxury villa, it’s more than likely that you’ll be moving at one point or another (you’ll get tired of that boring old villa eventually). But when it comes to hiring a professional mover, who’s footing the bill?

The AMSA crunched the numbers to see just who was paying for household shipments made by moving companies:8

  • Individuals make up 44% of household goods shipments.
  • Corporations sponsor the second largest group of household shipments at 39%.
  • The military is responsible for 16% of the nation’s household shipments while the remaining 1% is completed by other federal government offices.

Individuals are responsible for less than half of all professional household moves—meaning the odds are in your favor that either your employer or Uncle Sam will help pay for your move.

Let us help with your next move!

Are you planning on moving soon? Whether it’s next month or next year, be sure to check out our ultimate homebuyer checklist to get everything ready, or find the mover that’s right for you with our list of the best moving companies.

Do you know any other interesting moving facts or statistics? Let us know in the comments below!


End Notes

1Average of numbers since 2010 from Census Data

2United States Census Bureau, “CPS Historical Migration/Geographic Mobility Tables

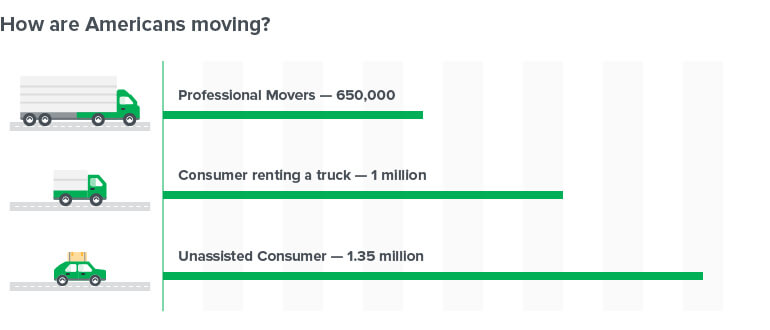
3American Moving and Storage Association, “About Our Industry”
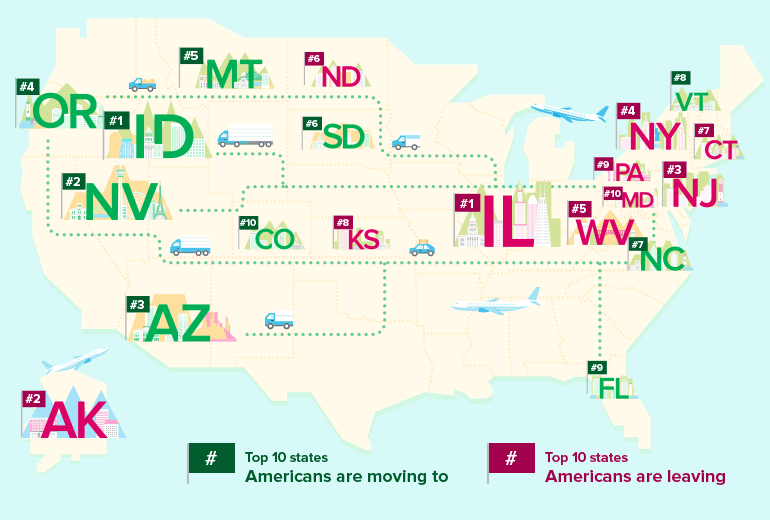
  1. Illinois – 66%
  2. Alaska – 65%
  3. New Jersey – 63%
  4. North York – 62%
  5. West Virginia – 60%
  6. North Dakota – 60%
  7. Connecticut – 58%
  8. Kansas – 57%
  9. Pennsylvania – 57%
  10. Maryland – 55%

4American Moving and Storage Association, “About Our Industry”
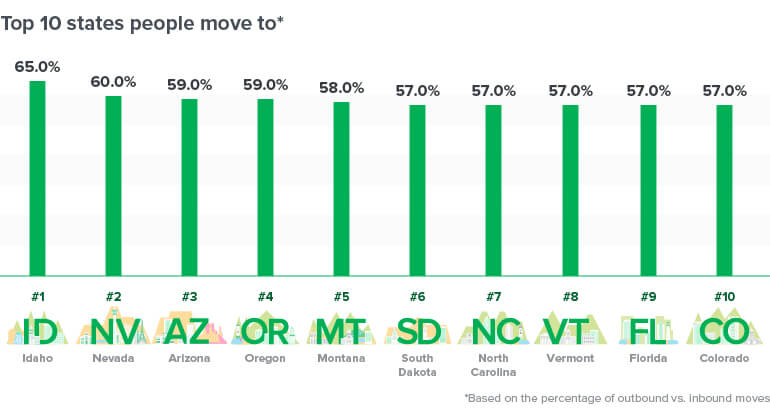
  1. Idaho – 65%
  2. Nevada – 60%
  3. Arizona – 59%
  4. Oregon – 59%
  5. Montana – 58%
  6. South Dakota – 57%
  7. North Carolina – 57%
  8. Vermont – 57%
  9. Florida – 57%
  10. Colorado – 57%

5 United States Census Bureau, “CPS Historical Migration/Geographic Mobility Tables

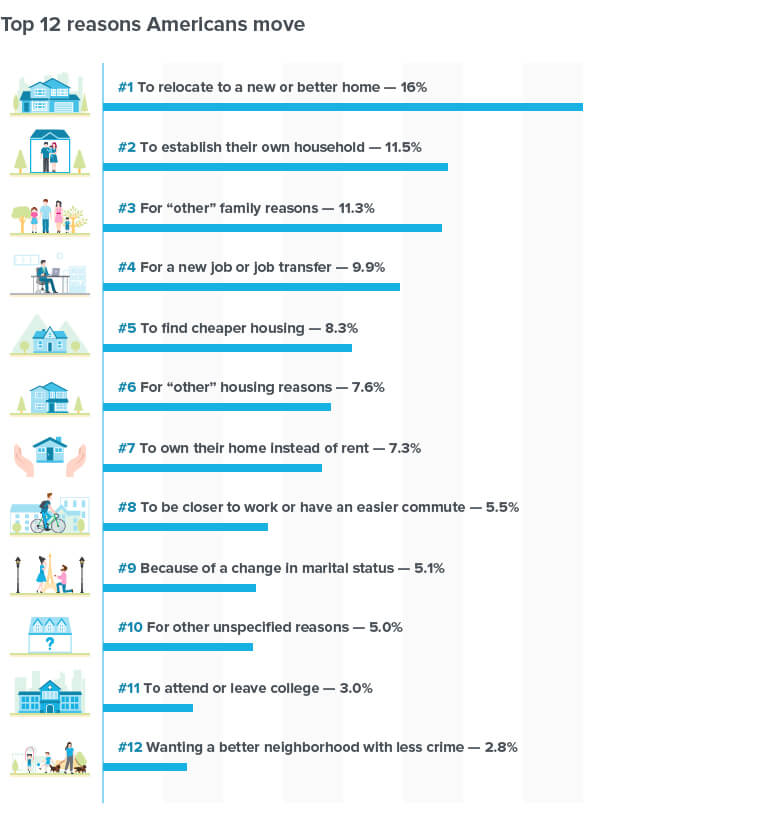
  1. To relocate to a new or better home — 16%
  2. To establish their own household — 11.5%
  3. For “other” family reasons — 11.3%
  4. For a new job or job transfer — 9.9%
  5. To find cheaper housing — 8.3%
  6. For “other” housing reasons — 7.6%
  7. To own their home instead of rent — 7.3%
  8. To be closer to work or have an easier commute — 5.5%
  9. Because of a change in marital status — 5.1%
  10. For other unspecified reasons — 5%
  11. To attend or leave college — 3%
  12. Wanting a better neighborhood with less crime — 2.8%

6 United States Census Bureau, “CPS Historical Migration/Geographic Mobility Tables
7 American Moving and Storage Association, “About Our Industry”
8 American Moving and Storage Association, “About Our Industry”

Colin Holmes
Written by
Colin Holmes
Colin Holmes is no stranger to moving: he’s done so five times in the last five years, and he’s used his expertise to help over 185,000 readers plan their moves in the last year alone. As a former journalist and documentary interviewer, Colin brings a wealth of research experience to Move.org.