Rank | City | Median Home Value | Population | Percentage of homes built in or since 2000 | Percentage of occupied homes |
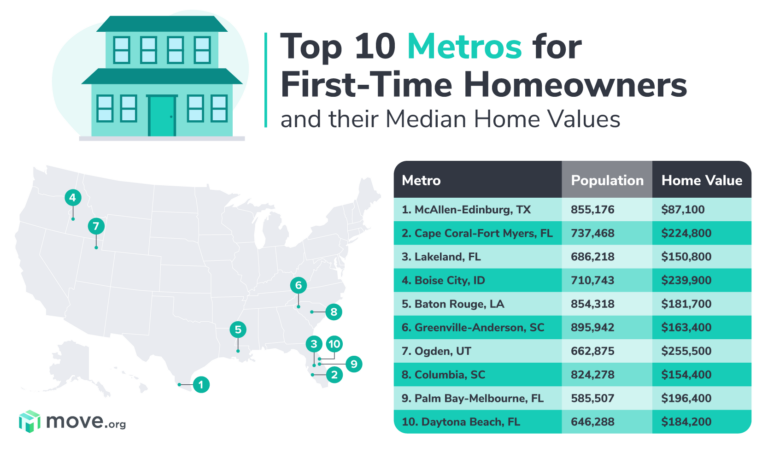
1
| McAllen-Edinburg-Mission, TX Metro Area
| $87,100
| 855,176
| 40%
| 68%
|
|---|
2
| Cape Coral-Fort Myers, FL Metro Area
| $224,800
| 737,468
| 37%
| 72.3%
|
|---|
3
| Lakeland-Winter Haven, FL Metro Area
| $150,800
| 686,218
| 30%
| 68.9%
|
|---|
4
| Boise City, ID Metro Area
| $239,900
| 710,743
| 35%
| 69.7%
|
|---|
5
| Baton Rouge, LA Metro Area
| $181,700
| 854,318
| 29%
| 69%
|
|---|
6
| Greenville-Anderson, SC Metro Area
| $163,400
| 895,942
| 25%
| 68.5%
|
|---|
7
| Ogden-Clearfield, UT Metro Area
| $255,500
| 662,875
| 29%
| 75.8%
|
|---|
8
| Columbia, SC Metro Area
| $154,400
| 824,278
| 28%
| 67.9%
|
|---|
9
| Palm Bay-Melbourne-Titusville, FL Metro Area
| $196,400
| 585,507
| 22%
| 74.3%
|
|---|
10
| Deltona-Daytona Beach-Ormond Beach, FL Metro Area
| $184,200
| 646,288
| 25%
| 71.2%
|
|---|
11
| Augusta-Richmond County, GA-SC Metro Area
| $146,100
| 599,616
| 25%
| 67.1%
|
|---|
12
| Des Moines-West Des Moines, IA Metro Area
| $182,400
| 680,439
| 27%
| 69.7%
|
|---|
13
| North Port-Sarasota-Bradenton, FL Metro Area
| $246,400
| 803,709
| 27%
| 74%
|
|---|
14
| Charlotte-Concord-Gastonia, NC-SC Metro Area
| $200,000
| 2,545,560
| 33%
| 65.7%
|
|---|
15
| Little Rock-North Little Rock-Conway, AR Metro Area
| $154,600
| 737,015
| 28%
| 64.1%
|
|---|
16
| Knoxville, TN Metro Area
| $171,300
| 853,337
| 22%
| 68.7%
|
|---|
17
| Raleigh-Cary, NC Metro Area
| $249,800
| 1,332,311
| 39%
| 65.7%
|
|---|
18
| El Paso, TX Metro Area
| $121,300
| 840,477
| 28%
| 61.2%
|
|---|
19
| Jackson, MS Metro Area
| $145,600
| 597,727
| 22%
| 67.3%
|
|---|
20
| Birmingham-Hoover, AL Metro Area
| $165,200
| 1,085,330
| 22%
| 68.9%
|
|---|
21
| Grand Rapids-Kentwood, MI Metro Area
| $172,900
| 1,062,392
| 17%
| 72.8%
|
|---|
22
| Provo-Orem, UT Metro Area
| $303,300
| 616,791
| 40%
| 67.9%
|
|---|
23
| Chattanooga, TN-GA Metro Area
| $163,100
| 556,209
| 21%
| 67.1%
|
|---|
24
| Winston-Salem, NC Metro Area
| $152,400
| 666,216
| 20%
| 66.8%
|
|---|
25
| San Antonio-New Braunfels, TX Metro Area
| $171,000
| 2,468,193
| 32%
| 62.6%
|
|---|
26
| Charleston-North Charleston, SC Metro Area
| $236,700
| 774,508
| 33%
| 66.2%
|
|---|
27
| Jacksonville, FL Metro Area
| $204,700
| 1,503,574
| 31%
| 64.5%
|
|---|
28
| Oklahoma City, OK Metro Area
| $157,600
| 1,382,841
| 24%
| 63.8%
|
|---|
29
| Tulsa, OK Metro Area
| $150,500
| 990,544
| 21%
| 64.8%
|
|---|
30
| Nashville-Davidson--Murfreesboro--Franklin, TN Metro Area
| $240,800
| 1,871,903
| 30%
| 65.6%
|
|---|
31
| Albuquerque, NM Metro Area
| $192,800
| 912,108
| 22%
| 67%
|
|---|
32
| Indianapolis-Carmel-Anderson, IN Metro Area
| $163,100
| 2,029,472
| 22%
| 65.2%
|
|---|
33
| Greensboro-High Point, NC Metro Area
| $149,200
| 762,063
| 21%
| 62.6%
|
|---|
34
| Houston-The Woodlands-Sugar Land, TX Metro Area
| $193,900
| 6,884,138
| 34%
| 60.4%
|
|---|
35
| Louisville/Jefferson County, KY-IN Metro Area
| $169,500
| 1,257,088
| 18%
| 67.1%
|
|---|
36
| Wichita, KS Metro Area
| $139,000
| 637,690
| 17%
| 65%
|
|---|
37
| Tucson, AZ Metro Area
| $184,100
| 1,027,207
| 23%
| 63.2%
|
|---|
38
| Phoenix-Mesa-Chandler, AZ Metro Area
| $250,000
| 4,761,603
| 32%
| 63.4%
|
|---|
39
| Atlanta-Sandy Springs-Alpharetta, GA Metro Area
| $217,000
| 5,862,424
| 31%
| 63.3%
|
|---|
40
| St. Louis, MO-IL Metro Area
| $172,700
| 2,805,190
| 15%
| 68.9%
|
|---|
41
| Omaha-Council Bluffs, NE-IA Metro Area
| $171,000
| 931,779
| 21%
| 65.5%
|
|---|
42
| Pittsburgh, PA Metro Area
| $154,000
| 2,331,447
| 9%
| 69.6%
|
|---|
43
| Orlando-Kissimmee-Sanford, FL Metro Area
| $221,600
| 2,508,970
| 33%
| 60.9%
|
|---|
44
| Durham-Chapel Hill, NC Metro Area
| $226,100
| 626,695
| 29%
| 61.7%
|
|---|
45
| Cincinnati, OH-KY-IN Metro Area
| $168,900
| 2,201,741
| 16%
| 66.4%
|
|---|
46
| Tampa-St. Petersburg-Clearwater, FL Metro Area
| $193,500
| 3,097,859
| 22%
| 64.9%
|
|---|
47
| Harrisburg-Carlisle, PA Metro Area
| $183,400
| 571,013
| 15%
| 67.6%
|
|---|
48
| Akron, OH Metro Area
| $150,000
| 703,845
| 12%
| 66.6%
|
|---|
49
| Kansas City, MO-KS Metro Area
| $183,300
| 2,124,518
| 19%
| 65.1%
|
|---|
50
| Scranton--Wilkes-Barre, PA Metro Area
| $139,400
| 555,642
| 8%
| 67%
|
|---|
51
| Austin-Round Rock-Georgetown, TX Metro Area
| $281,500
| 2,114,441
| 42%
| 58.2%
|
|---|
52
| Syracuse, NY Metro Area
| $137,200
| 652,416
| 9%
| 67.6%
|
|---|
53
| Detroit-Warren-Dearborn, MI Metro Area
| $170,000
| 4,317,848
| 11%
| 69%
|
|---|
54
| Toledo, OH Metro Area
| $130,900
| 644,137
| 11%
| 63.3%
|
|---|
55
| Memphis, TN-MS-AR Metro Area
| $152,200
| 1,339,623
| 20%
| 59.8%
|
|---|
56
| Dallas-Fort Worth-Arlington, TX Metro Area
| $215,700
| 7,320,663
| 30%
| 59.5%
|
|---|
57
| Rochester, NY Metro Area
| $144,400
| 1,072,877
| 10%
| 67.1%
|
|---|
58
| Columbus, OH Metro Area
| $184,800
| 2,077,761
| 20%
| 61.5%
|
|---|
59
| Minneapolis-St. Paul-Bloomington, MN-WI Metro Area
| $257,000
| 3,573,609
| 19%
| 70%
|
|---|
60
| Dayton-Kettering, OH Metro Area
| $135,000
| 803,543
| 10%
| 63.2%
|
|---|
61
| Salt Lake City, UT Metro Area
| $298,600
| 1,201,043
| 24%
| 67.8%
|
|---|
62
| Cleveland-Elyria, OH Metro Area
| $151,600
| 2,056,898
| 9%
| 64.9%
|
|---|
63
| Richmond, VA Metro Area
| $237,500
| 1,269,530
| 21%
| 65.6%
|
|---|
64
| Buffalo-Cheektowaga, NY Metro Area
| $148,500
| 1,130,175
| 7%
| 65.7%
|
|---|
65
| Las Vegas-Henderson-Paradise, NV Metro Area
| $262,700
| 2,182,004
| 37%
| 53.8%
|
|---|
66
| Colorado Springs, CO Metro Area
| $275,700
| 723,498
| 26%
| 64.7%
|
|---|
67
| Allentown-Bethlehem-Easton, PA-NJ Metro Area
| $213,800
| 837,610
| 15%
| 68.8%
|
|---|
68
| New Orleans-Metairie, LA Metro Area
| $197,800
| 1,267,777
| 16%
| 62.3%
|
|---|
69
| Bakersfield, CA Metro Area
| $213,900
| 887,641
| 22%
| 58.3%
|
|---|
70
| Madison, WI Metro Area
| $248,400
| 653,725
| 23%
| 61.1%
|
|---|
71
| Albany-Schenectady-Troy, NY Metro Area
| $213,600
| 880,736
| 13%
| 63.9%
|
|---|
72
| Virginia Beach-Norfolk-Newport News, VA-NC Metro Area
| $245,100
| 1,761,729
| 19%
| 61.7%
|
|---|
73
| Chicago-Naperville-Elgin, IL-IN-WI Metro Area
| $239,600
| 9,508,605
| 14%
| 64.5%
|
|---|
74
| Philadelphia-Camden-Wilmington, PA-NJ-DE-MD Metro Area
| $250,700
| 6,079,130
| 11%
| 67.3%
|
|---|
75
| Milwaukee-Waukesha, WI Metro Area
| $213,900
| 1,575,223
| 11%
| 60.1%
|
|---|
76
| Riverside-San Bernardino-Ontario, CA Metro Area
| $341,300
| 4,560,470
| 25%
| 63.3%
|
|---|
77
| Worcester, MA-CT Metro Area
| $269,600
| 941,338
| 11%
| 65.6%
|
|---|
78
| Springfield, MA Metro Area
| $228,100
| 699,480
| 7%
| 63.2%
|
|---|
79
| Poughkeepsie-Newburgh-Middletown, NY Metro Area
| $276,500
| 673,839
| 14%
| 67.7%
|
|---|
80
| Baltimore-Columbia-Towson, MD Metro Area
| $298,500
| 2,796,733
| 14%
| 66.5%
|
|---|
81
| Hartford-East Hartford-Middletown, CT Metro Area
| $249,200
| 1,207,677
| 9%
| 66.3%
|
|---|
82
| Denver-Aurora-Lakewood, CO Metro Area
| $380,900
| 2,892,066
| 24%
| 63.9%
|
|---|
83
| Fresno, CA Metro Area
| $255,000
| 984,521
| 20%
| 53.3%
|
|---|
84
| Portland-Vancouver-Hillsboro, OR-WA Metro Area
| $368,800
| 2,445,761
| 21%
| 62.4%
|
|---|
85
| Miami-Fort Lauderdale-Pompano Beach, FL Metro Area
| $280,400
| 6,090,660
| 17%
| 59.3%
|
|---|
86
| Stockton, CA Metro Area
| $342,100
| 742,603
| 23%
| 56.6%
|
|---|
87
| Providence-Warwick, RI-MA Metro Area
| $276,900
| 1,618,268
| 8%
| 61.4%
|
|---|
88
| New Haven-Milford, CT Metro Area
| $248,600
| 857,513
| 7%
| 61.8%
|
|---|
89
| Sacramento-Roseville-Folsom, CA Metro Area
| $387,500
| 2,315,980
| 21%
| 60.3%
|
|---|
90
| Seattle-Tacoma-Bellevue, WA Metro Area
| $436,100
| 3,871,323
| 23%
| 60.1%
|
|---|
91
| Washington-Arlington-Alexandria, DC-VA-MD-WV Metro Area
| $424,000
| 6,196,585
| 21%
| 63.6%
|
|---|
92
| Bridgeport-Stamford-Norwalk, CT Metro Area
| $428,500
| 943,926
| 11%
| 67.1%
|
|---|
93
| Boston-Cambridge-Newton, MA-NH Metro Area
| $437,500
| 4,832,346
| 12%
| 61.7%
|
|---|
94
| Oxnard-Thousand Oaks-Ventura, CA Metro Area
| $588,400
| 847,263
| 13%
| 63.2%
|
|---|
95
| New York-Newark-Jersey City, NY-NJ-PA Metro Area
| $450,900
| 19,294,236
| 10%
| 51.3%
|
|---|
96
| San Diego-Chula Vista-Carlsbad, CA Metro Area
| $563,700
| 3,316,073
| 16%
| 53.3%
|
|---|
97
| Urban Honolulu, HI Metro Area
| $678,200
| 984,821
| 15%
| 56.2%
|
|---|
98
| Los Angeles-Long Beach-Anaheim, CA Metro Area
| $613,400
| 13,249,614
| 9%
| 48.6%
|
|---|
99
| San Francisco-Oakland-Berkeley, CA Metro Area
| $840,600
| 4,701,332
| 11%
| 54.7%
|
|---|
100
| San Jose-Sunnyvale-Santa Clara, CA Metro Area
| $968,800
| 1,987,846
| 15%
| 56.6%
|
|---|