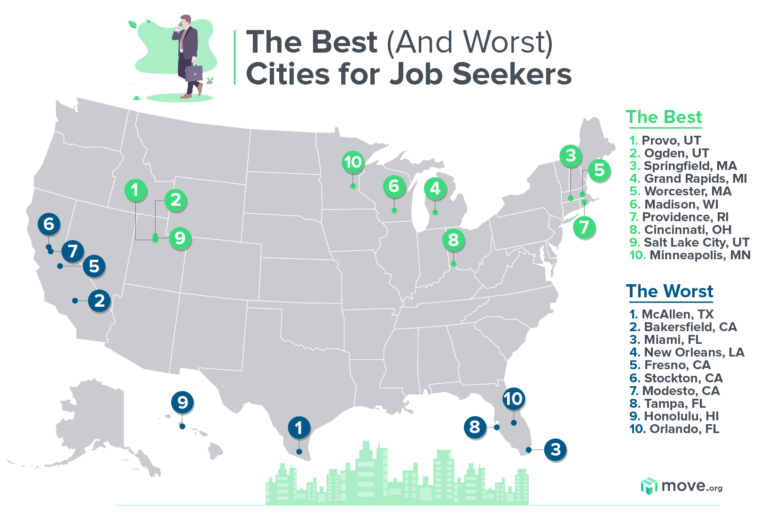
What are the worst US cities for job seekers?
|
|
Score (out of 100)
| 29.1
|
|---|
Population
| 849,389
|
|---|
Unemployment rate
| 7.00%
|
|---|
Median household income
| $38,398
|
|---|
Median household rent
| $716
|
|---|
Rent as a percentage of income
| 22.4%
|
|---|
Average hours worked
| 39.1
|
|---|
People say everything is bigger in Texas. From 10-gallon cowboy hats to high school football stadiums that regularly fill over 10,000 seats, the state has a reputation for big things—including unemployment rates.
McAllen has an unemployment rate of 7.0%. That’s more than four times higher than the number one city on our list. For those that do have jobs, the median household income is only $38,398—the third-worst of any city on our list.
|
|
Score (out of 100)
| 30.6
|
|---|
Population
| 883,053
|
|---|
Unemployment rate
| 7.20%
|
|---|
Median household income
| $52,479
|
|---|
Median household rent
| $956
|
|---|
Rent as a percentage of income
| 21.9%
|
|---|
Average hours worked
| 39
|
|---|
The Bakersfield Museum of Art is home to some of the finest works of California artists, but there’s nothing appealing about the city’s 7.2% unemployment rate.
Workers can expect to pay more than $950 per month for rent. That might not sound too bad until you compare it to the median household income of $52,479. At the end of the month, residents put nearly 22% of everything they earn toward rent.
While that’s still below a universal benchmark of 30%, it pales in comparison to cities like Ogden and Cincinnati that have rates lower than 16%.
|
|
Score (out of 100)
| 32.0
|
|---|
Population
| 6,070,944
|
|---|
Unemployment rate
| 2.20%
|
|---|
Median household income
| $54,239
|
|---|
Median household rent
| $1,295
|
|---|
Rent as a percentage of income
| 28.7%
|
|---|
Average hours worked
| 38.6
|
|---|
Burn Notice’s Michael Westen was a nightmare for fictional bad guys in Miami, but the city’s real housing prices will make you feel like you’re in a bad dream of your own.
The median household rent in Miami is nearly $1,300—or 28.7% of the median household income. Ouch!
|
|
Score (out of 100)
| 35.3
|
|---|
Population
| 1,263,635
|
|---|
Unemployment rate
| 4.40%
|
|---|
Median household income
| $51,449
|
|---|
Median household rent
| $969
|
|---|
Rent as a percentage of income
| 22.6%
|
|---|
Average hours worked
| 39.5
|
|---|
New Orleans is known as the “Big Easy,” but finding a job there is anything but easy with a 4.4% unemployment rate.
More than a fifth of the median household income goes toward rent, and workers average almost a full 40-hour workweek.
|
|
Score (out of 100)
| 37.4
|
|---|
Population
| 978,130
|
|---|
Unemployment rate
| 6.90%
|
|---|
Median household income
| $51,261
|
|---|
Median household rent
| $967
|
|---|
Rent as a percentage of income
| 22.6%
|
|---|
Average hours worked
| 37.9
|
|---|
The Fresno Chaffee Zoo has an exotic stingray touch pool, but you don’t have to buy tickets to feel the pain.
The median household income is only $51,261 in a state known for its high cost of living. Fresno also has a scary unemployment rate of nearly 7%.
|
|
Score (out of 100)
| 38.0
|
|---|
Population
| 732,212
|
|---|
Unemployment rate
| 5.70%
|
|---|
Median household income
| $61,145
|
|---|
Median household rent
| $1,159
|
|---|
Rent as a percentage of income
| 22.7%
|
|---|
Average hours worked
| 38.4
|
|---|
The Children’s Museum of Stockton has some fun hands-on exhibits for your kids to enjoy, but you’ll probably need the babysitter to take them to the museum for you.
Stockton residents work an average of 38.4 hours per week—or 3.5 more hours than our top-ranked city.
|
|
Score (out of 100)
| 39.9
|
|---|
Population
| 539,301
|
|---|
Unemployment rate
| 5.60%
|
|---|
Median household income
| $57,387
|
|---|
Median household rent
| $1,099
|
|---|
Rent as a percentage of income
| 23.0%
|
|---|
Average hours worked
| 38.1
|
|---|
Modesto is the hometown of George Lucas, the filmmaker known for hits such as Indiana Jones, Star Wars, and American Graffiti.
It’s also the place to go for astronomical housing costs. The average household rent in Modesto is only a dollar short of $1,100, and the unemployment rate is an unpleasant 5.6%.
|
|
Score (out of 100)
| 40.0
|
|---|
Population
| 3,030,047
|
|---|
Unemployment rate
| 2.60%
|
|---|
Median household income
| $52,882
|
|---|
Median household rent
| $1,070
|
|---|
Rent as a percentage of income
| 24.3%
|
|---|
Average hours worked
| 39.1
|
|---|
Tampa is home to the Busch Gardens amusement park. And it’s a good thing—workers in the city need a distraction from real life.
Tampa employees average 39.1 hours at work each week only to write a rent check for nearly a quarter of their income.
|
|
Score (out of 100)
| 40.0
|
|---|
Population
| 987,638
|
|---|
Unemployment rate
| 2.10%
|
|---|
Median household income
| $82,906
|
|---|
Median household rent
| $1,703
|
|---|
Rent as a percentage of income
| 24.6%
|
|---|
Average hours worked
| 39.2
|
|---|
Hawaii is where a lot of people go to get away from the stress of real life, but workers in Honolulu have stresses of their own.
The city has a healthy median income of $82,906, but the household rent is over $1,700 per month—or 24.6% of income. That’s nearly 10% more than Provo, UT, our top-ranked city.
|
|
Score (out of 100)
| 40.2
|
|---|
Population
| 2,450,261
|
|---|
Unemployment rate
| 2.50%
|
|---|
Median household income
| $55,095
|
|---|
Median household rent
| $1,161
|
|---|
Rent as a percentage of income
| 25.3%
|
|---|
Average hours worked
| 38.7
|
|---|
Orlando is home to the Wizarding World of Harry Potter, the amusement park that brings to life magical adventures from the imagination of J. K. Rowling.
It’s also the place you go for a less-than-magical combination of low income and high rent. Orlandoans pay $1,161 for housing, but the median household income is only $55,095. More than 25 cents out of every dollar goes toward rent.
Company | Type of Mover | Average quote
 | Deposit amount | Service locations | Learn more |
|  Full-service mover Full-service mover | $8,750 | None | 50 states | Get a Quote |
|---|
| Full-service mover | $9,000 | Up to 40% | 40–46 states* | Get a Quote |
|---|
| Full-service mover | $7,746 | 10%–50% | 50 states | Get a Quote |
|---|
| Full-service mover | $9,000 | None | 50 states | Get a Quote |
|---|
| Full-service mover | $9,250 | 25% | 48 states | Get a Quote |
|---|
Data as of post date. Offers and availability may vary by location and are subject to change. Pricing data collected by requesting estimates from top moving container companies for four home sizes across six distances.
*There are 10 states where Colonial can't pick up your belongings, and four where they can't deliver. Call Colonial to confirm availability.