Here’s Where Home Prices Increased the Most in the Last Year

Trevor Wheelwright
Aug 02, 2021
bullet3 min read

Unfortunately for potential homebuyers in the US, the average price of a single-family home increased by 12.4% and the average one-bedroom home’s price increased by 10.9%.1

Between record-low interest rates and pandemic-related shifts, the US faces a housing crisis that can be summed up by increased demand and low inventory.

To determine how much housing prices have increased in each state, we compared single-family and one-bedroom home values from May 2020 to May 2021 using the Zillow Home Value Index.


How much housing prices have changed during the pandemic

Single-family home price increases

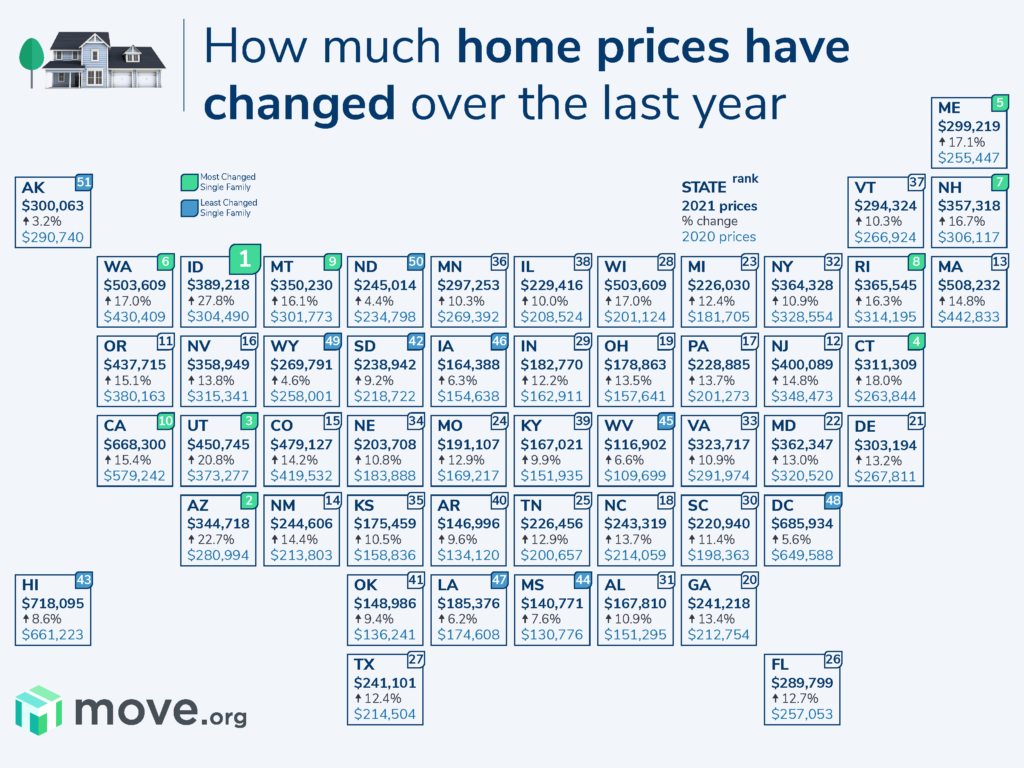
The average cost of a single-family home in 2020 was $267,726, but in 2021, the average cost increased to $301,855—that’s a difference of about $34,000 (or half a year’s median salary). Nationwide, single-family home price increases ranged from 3.2% to 27% (yikes!).

bullet
Planning on relocating?

Check out our Best Moving Companies of 2022 guide that our moving experts put together after researching professional moving companies across the country to determine the ones that can make your long-distance move the most organized, easy, and stress-free as can be.

Where did single-family home prices increase the most?

Rank
State
Average single-family home price (5/31/2020)
Average single-family home price (5/31/2021)
% change
1Idaho$304,490$389,21827.8%
2Arizona$280,994$344,71822.7%
3Utah$373,277$450,74520.8%
4Connecticut$263,844$311,30918.0%
5Maine$255,447$299,21917.1%
6Washington$430,409$503,60917.0%
7New Hampshire$306,117$357,31816.7%
8Rhode Island$314,195$365,54516.3%
9Montana$301,773$350,23016.1%
10California$579,242$668,30015.4%
  • A total of 38 states faced single-family home price percentage increases in the double digits, and 3 states faced an over 20% increase: Idaho, Arizona, and Utah.
  • Some western states and states on the East Coast saw some of the highest increases, but Idaho’s single-family home prices increased the most by 27.8% year over year.
  • Washington, California, and Massachusetts, which have some of the highest home prices in the US, also saw a significant increase in single-family home prices.

Where did single-family home prices increase the least?

Rank
State
Average single-family home price (5/31/2020)
Average single-family home price (5/31/2021)
% change
51Alaska$290,740$300,0633.2%
50North Dakota$234,798$245,0144.4%
49Wyoming$258,001$269,7914.6%
48District of Columbia$649,588$685,9345.6%
47Louisiana$174,608$185,3766.2%
46Iowa$154,638$164,3886.3%
45West Virginia$109,699$116,9026.6%
44Mississippi$130,776$140,7717.6%
43Hawaii$661,223$718,0958.6%
42South Dakota$218,722$238,9429.2%

     Alaska saw only a 3.2% increase in single-family home prices, the lowest in the nation.

     Only 13 states managed to keep housing price increases under 10% year to year; only 3 states saw less than 5% increases: Alaska, North Dakota, and Wyoming.

     Despite having one of the most expensive average home prices in the US, Washington DC saw one of the smallest single-family home price increases at 5.6% (the fourth lowest in the US).

While housing prices increased everywhere, some states’ single-family home prices fluctuated far more than their one-bedroom home prices. This may reflect inventory and demographic demands.

For example, single-family homes in Massachusetts, New Jersey, and California increased by nearly 15%, while one-bedroom homes increased by 10% or less—meaning that these states had more families moving in with fewer homes to supply the demand.


One-bedroom home price increases

For potential buyers looking at one-bedroom homes (which are cheaper in every state except  New York), prices increased anywhere from 0.5% to 23.7%. In total, 31 states saw double-digit price increases for single-bedroom homes.

Where did one-bedroom home prices increase the most?

Rank
State
Average one-bedroom home price (5/31/2020)
Average one-bedroom home price (5/31/2021)
% change
1Idaho$215,479$266,61123.7%
2Arizona$152,318$184,96721.4%
3Utah$261,810$308,29517.8%
4Montana$213,006$249,74817.2%
5Connecticut$117,444$136,90516.6%
6New Hampshire$151,607$175,50415.8%
7Maine$187,030$216,36115.7%
8Rhode Island$198,435$228,62215.2%
9New Mexico$152,460$175,28615.0%
10Ohio$80,988$92,53214.3%
  • Idaho, Arizona, and Utah had the highest price increases for both one-bedroom homes and single-family homes. Along with Montana and New Mexico, these western states’ prices skyrocketed over the past year.
  • The East Coast also had plenty of high price increases in states like Connecticut, New Hampshire, Maine, and Rhode Island.

Where did one-bedroom home prices increase the least?

Rank
State
Average single-family home price (5/31/2020)
Average single-family home price (5/31/2021)
% change
51North Dakota$114,972$115,5360.5%
50District of Columbia$410,856$419,2302.0%
49Hawaii$405,335$417,8003.1%
48Louisiana$128,560$134,0354.3%
47New York$361,488$379,3915.0%
46Illinois$149,476$157,7995.6%
45Wyoming$175,237$186,2276.3%
44West Virginia$59,542$63,6206.8%
43Minnesota$158,352$169,5257.1%
42Iowa$81,795$87,6409.2%
  • Fortunately for folks looking to buy a one-bedroom home in North Dakota, the housing market changed very little, with a 0.5% increase in prices.
  • With some surprise on our end, DC, Hawaii, and Louisiana all saw less than 5% increases for one-bedroom houses.
  • New York’s one-bedroom prices may not have increased by as much as others, but you could buy a single-family home in the Empire State for a lower price.

Whether you’re buying or selling, it’s always a question of where you’re going to move next that ultimately determines whether you should wait it out or take the leap with homeownership.

If you can rent for far less while staying in the city you love, or if you can work remotely and pay far less to own a home somewhere else, it may be worth it to sell. But for a lot of prospective buyers, they may be out of the market altogether—at least until more homes are built, vacated, or otherwise made available.


Home price increases in the last year

Rank
State
Last year’s average single-family home price (5/31/2020)
This year’s average single-family home price (5/31/2021)
Percentage change
1Idaho$304,490$389,21827.8%
2Arizona$280,994$344,71822.7%
3Utah$373,277$450,74520.8%
4Connecticut$263,844$311,30918.0%
5Maine$255,447$299,21917.1%
6Washington$430,409$503,60917.0%
7New Hampshire$306,117$357,31816.7%
8Rhode Island$314,195$365,54516.3%
9Montana$301,773$350,23016.1%
10California$579,242$668,30015.4%15.4%
11Oregon$380,163$437,71515.1%
12New Jersey$348,473$400,08914.8%
13Massachusetts$442,833$508,23214.8%
14New Mexico$213,803$244,60614.4%
15Colorado$419,532$479,12714.2%
16Nevada$315,341$358,94913.8%
17Pennsylvania$201,273$228,88513.7%
18North Carolina$214,059$243,31913.7%
19Ohio$157,641$178,86313.5%
20Georgia$212,754$241,21813.4%
21Delaware$267,811$303,19413.2%
22Maryland$320,520$362,34713.0%
23Michigan$181,705$205,35313.0%
24Missouri$169,217$191,10712.9%
25Tennessee$200,657$226,45612.9%
26Florida$257,053$289,79912.7%
27Texas$214,504$241,10112.4%
28Wisconsin$201,124$226,03012.4%
29Indiana$162,911$182,77012.2%
30South Carolina$198,363$220,94011.4%
31Alabama$151,295$167,81010.9%
32New York$328,554$364,32810.9%
33Virginia$291,974$323,71710.9%
34Nebraska$183,888$203,70810.8%
35Kansas$158,836$175,45910.5%
36Minnesota$269,392$297,25310.3%
37Vermont$266,924$294,32410.3%
38Illinois$208,524$229,41610.0%
39Kentucky$151,935$167,0219.9%
40Arkansas$134,120$146,9969.6%
41Oklahoma$136,241$148,9869.4%
42South Dakota$218,722$238,9429.2%
43Hawaii$661,223$718,0958.6%
44Mississippi$130,776$140,7717.6%
45West Virginia$109,699$116,9026.6%
46Iowa$154,638$164,3886.3%
47Louisiana$174,608$185,3766.2%
48District of Columbia$649,588$685,9345.6%
49Wyoming$258,001$269,7914.6%
50North Dakota$234,798$245,0144.4%
51Alaska$290,740$300,0633.2%

Methodology

To find how housing prices changed over the last year, we compared Zillow home values from May 2020 to May 2021 using the Zillow Home Value Index.

Zillow Home Value Index (ZHVI): A smoothed, seasonally adjusted measure of the typical home value and market changes across a given region and housing type. This measurement reflects the typical value for homes in the 35th to 65th percentile range.

Sources

  1. Zillow, “United States Home Prices and Home Values.” Accessed June 24, 2021.
Trevor Wheelwright
Written by
Trevor Wheelwright
Trevor’s written about home products and services for over six years across editorial publications and retail/eCommerce sites. His work's been featured on Forbes, RealSimple, USA Today, MSN, BusinessInsider, Entrepreneur, PCMag, and CNN. When he’s not researching and writing, you can find him around Salt Lake City, Utah, snapping photos of mountains and architecture or seeking out some good tunes and friendly faces.