Which States Have the Most Mortgage-Free Homeowners?

Colin Holmes
Dec 12, 2018
Icon Time To Read5 min read
Which States Have the Most Mortgage-Free Homeowners?

Homeownership is one of the marquee features of the American Dream. But how many Americans actually own their homes?

Most house hunters don’t arrive at the closing table with a briefcase full of Benjamins. Nor are they as lucky as that kid from the forgotten ’90s classic Blank Check. (P.S. There’s no way he could buy that house for only $300,000. Not even in ’94.)

Most of us need a mortgage—otherwise known as a home loan.

Over 62% of US homes carry a mortgage,1 but some states have a much higher percentage of mortgage-free homes than others. So which states reign supreme as the most mortgage free of all?

Read on to learn who we ranked as the most mortgage-free states in America.

Map Pin
Planning on relocating?

Check out our Best Moving Companies of 2022 guide that our moving experts put together after researching professional moving companies across the country to determine the ones that can make your long-distance move the most organized, easy, and stress-free as can be.


Factors we considered

Using the US Census Bureau’s 2017 American Community Survey, we looked at three factors to determine our rankings:

  • The total number of owner-occupied housing units in each state
  • The percentage of owner-occupied housing units with a mortgage
  • The percentage of owner-occupied housing units without a mortgage

After collecting each state’s percentage of owner-occupied housing units with and without a mortgage, we ranked them from highest to lowest percentage of mortgage-free homes.

To learn more about how we calculated our rankings, check out our methodology section.


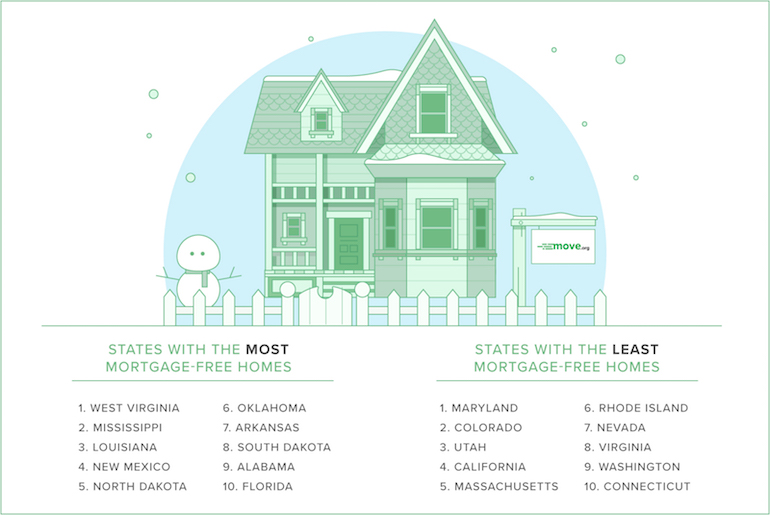
America’s top 10 states for mortgage-free homes

Thinking about moving?

Company
Company type
Move.org rating
Packing & loading services
Pricing
Discounts
Learn more
Professional mover
4.8 out of 5 stars
4.8
Icon Yes  LightYes
$$$
Icon Yes  Light10% Move.org discount, military personnel, seniors
Professional mover
4.5 out of 5 stars
4.5
Icon Yes  LightYes
$$$
Icon No  LightNone
Professional mover
4.8 out of 5 stars
4.8
Icon Yes  LightYes
$$$
Icon Yes  LightSeniors
Moving container company
4.6 out of 5 stars
4.6
Icon No  LightNo
$$
Icon Yes  Light25% Move.org discount, military personnel
Moving container company
4.5 out of 5 stars
4.5
Icon No  LightNo
$$
Icon Yes  LightMove.org readers, military personnel

#1: West Virginia

West Virginia’s homeowners lead the pack with an astonishingly high mortgage-free rate of 54%. In fact, the Mountain State boasts 3% more mortgage-free homes than our runner-up, Mississippi.

West Virginia’s homeownership data

Rank
Owner-occupied housing units
Homes with a mortgage (%)
Mortgage-free homes (%)

1

518,882

45.94%

54.06%

#2: Mississippi

Fun fact: Pine-Sol was developed in 1929 by Mississippi native Harry Cole.2

Another fun fact: Mississippi has the second-most mortgage-free homes in the nation—and nothing smells better than a paid-for home.

Mississippi’s homeownership data

Rank
Owner-occupied housing units
Homes with a mortgage (%)
Mortgage-free homes (%)

2

748,055

49.11%

50.89%

#3: Louisiana

Louisiana is the first state in our top ten to drop below the 50% threshold for households with no mortgage debt, but a 47% mortgage-free rate is still impressive.

To put it in perspective, Louisiana’s 536,000 paid-for homes could house the entire population of Sacramento and then some.3 As Oprah might put it, “You get a house! And you get a house! And…” You get the picture.

Louisiana’s homeownership data

Rank
Owner-occupied housing units
Homes with a mortgage (%)
Mortgage-free homes (%)

3

1,132,229

52.69%

47.31%

#4: New Mexico

Although the majority of states in our top ten are located in the southeastern and midwestern US, the Land of Enchantment represents the West in our fourth spot.

Roughly 46% of owner-occupied homes in New Mexico are paid off.

New Mexico’s homeownership data

Rank
Owner-occupied housing units
Homes with a mortgage (%)
Mortgage-free homes (%)

4

521,450

53.63%

46.37%

#5: North Dakota

Tired of bustling cities and noisy neighbors? Well, look no further than North Dakota.

The Roughrider State has the fewest owner-occupied housing units in our top ten, and nearly 90% of its land is made up of farmland and ranches.4

Not only do its residents enjoy peace and quiet, but they also enjoy peace of mind: Over 45% of North Dakota’s homes are mortgage free.

North Dakota’s homeownership data

Rank
Owner-occupied housing units
Homes with a mortgage (%)
Mortgage-free homes (%)

5

200,554

54.50%

45.50%

#6: Oklahoma

It turns out Sooners tend to pay off their mortgages sooner rather than later.

More than 45% of Oklahoma’s homes are owned free and clear. That means over 400,000 households get to skip their mortgage bills every month.

Oklahoma’s homeownership data

Rank
Owner-occupied housing units
Homes with a mortgage (%)
Mortgage-free homes (%)

6

962,483

54.75%

45.25%

#7: Arkansas

There couldn’t be a better nickname than the Land of Opportunity for a state with such a high number of paid-for homes.

Arkansas ranks at number seven on our list with a mortgage-free rate of nearly 45%.

Arkansas’s homeownership data

Rank
Owner-occupied housing units
Homes with a mortgage (%)
Mortgage-free homes (%)

7

752,399

55.31%

44.69%

#8: South Dakota

South Dakota lands behind Arkansas in our rankings—but just barely. With a mortgage-free rate of 44.64%, Bob Barker’s home state is only 0.05% shy of nabbing the seventh spot.

Judging by the number of paid-off homes, we’d certainly say the price is right in South Dakota.

South Dakota’s homeownership data

Rank
Owner-occupied housing units
Homes with a mortgage (%)
Mortgage-free homes (%)

8

233,092

55.36%

44.64%

#9: Alabama

Although it comes first when you sing the lyrics to “Fifty Nifty United States,” Alabama is ninth on our list.

Over 43% of Alabama’s owner-occupied homes are owned outright—which means more than 547,000 homes in the Heart of Dixie are mortgage-free.

Alabama’s homeownership data

Rank
Owner-occupied housing units
Homes with a mortgage (%)
Mortgage-free homes (%)

9

1,253,199

56.35%

43.65%

#10: Florida

Florida has by far the most owner-occupied housing units in our top ten. It also has the most without a mortgage: a staggering 2.2 million. That’s nearly as many paid-for homes as the total number of homes in our top three states combined.

Since our rankings are based on the percentage of mortgage-free homes in each state, however, Florida rounds out our top ten.

Florida’s homeownership data

Rank
Owner-occupied housing units
Homes with a mortgage (%)
Mortgage-free homes (%)

10

5,010,187

56.88%

43.12%


States with the fewest mortgage-free homes

#41: Connecticut

New England is a notoriously expensive place to live, so it’s no surprise that it’s home to several states in our bottom ten.

Only about 32% of Connecticut’s owner-occupied homes are paid for. That’s 11% fewer than our number ten state, Florida.

Connecticut’s homeownership data

Rank
Owner-occupied housing units
Homes with a mortgage (%)
Mortgage-free homes (%)

41

898,234

68.05%

31.95%

#42: Washington

On the opposite side of the country, you’ll find our next state: Washington. With a paltry 31.18%, the Evergreen State ranks forty-second overall for mortgage-free homes.

Washington’s homeownership data

Rank
Owner-occupied housing units
Homes with a mortgage (%)
Mortgage-free homes (%)

42

1,783,549

68.82%

31.18%

#43: Virginia

Virginia comes next on our list, but it isn’t too far behind Washington. At 31.10%, Virginia’s mortgage-free rate means that just 646,000 of its 2 million owner-occupied housing units are free and clear.

Virginia’s homeownership data

Rank
Owner-occupied housing units
Homes with a mortgage (%)
Mortgage-free homes (%)

43

2,077,417

68.90%

31.10%

#44: Nevada

You might think that living inland would be easier on the pocketbook, but that’s not always the case.

As one of only three landlocked states in our bottom ten, Nevada has more than 427,000 mortgage-laden homes. That’s 69% of its owner-occupied units.

Nevada’s homeownership data

Rank
Owner-occupied housing units
Homes with a mortgage (%)
Mortgage-free homes (%)

44

619,309

69.01%

30.99%

#45: Rhode Island

Rhode Island may be the smallest state in the Union, but it has one of the highest percentages of homes with mortgages.

Like Nevada, over 69% of the Ocean State’s homes need to budget for mortgage payments each month.

Rhode Island’s homeownership data

Rank
Owner-occupied housing units
Homes with a mortgage (%)
Mortgage-free homes (%)

45

248,723

69.30%

30.70%

#46: Massachusetts

Living on the coast certainly has its perks, but paying off your home doesn’t seem to be one of them.

Massachusetts is one of five East Coast states in our bottom ten, and nearly 70% of its owner-occupied homes still have a mortgage.

Massachusett’s homeownership data

Rank
Owner-occupied housing units
Homes with a mortgage (%)
Mortgage-free homes (%)

46

1,623,515

69.94%

30.06%

#47: California

California has over 7.1 million owner-occupied housing units. With a median home value well above the national average,5 it’s easy to see why more than 70% of those homes have a mortgage.

California’s homeownership data

Rank
Owner-occupied housing units
Homes with a mortgage (%)
Mortgage-free homes (%)

47

7,125,090

70.54%

29.46%

#48: Utah

Home values in the Beehive State have risen almost 14% in the last year,6 almost doubling the national average increase of 7.7%.7 And with more people moving in from out of state, fewer residents can boast that they’re mortgage free.

Utah's homeownership data

Rank
Owner-occupied housing units
Homes with a mortgage (%)
Mortgage-free homes (%)

48

681,563 71.06%28.94%

#49: Colorado

Right next door to the forty-eighth state on our list is Colorado, which comes in at number forty-nine.

And much like their geographical proximity, both states’ mortgage-free rates are very close. Only 28.71% of Colorado’s homes are paid for—just 0.23% less than Utah.

Colorado's homeownership data

Rank
Owner-occupied housing units
Homes with a mortgage (%)
Mortgage-free homes (%)

49

1,394,824

71.29%

28.71%

#50: Maryland

At number 50, Maryland has the lowest percentage of paid-for homes in the entire US.

Only 27% of Maryland’s owner-occupied units are free and clear, leaving well over a million of the state’s homes saddled with a mortgage.

Maryland’s homeownership data

Rank
Owner-occupied housing units
Homes with a mortgage (%)
Mortgage-free homes (%)

50

1,472,500

72.87%

27.13%


Is your home paid off?

Are you one of the lucky homeowners in your state without a mortgage payment? Share the secret to your success in the comments below!


Methodology

Move.org used the US Census Bureau’s 2017 American Community Survey to collect homeownership statistics for US residents. We focused on the total owner-occupied housing units and looked at the percentage of homes with and without a mortgage. We then ranked the states from highest to lowest percentage of owner-occupied housing units without a mortgage.


Complete state rankings for mortgage-free homes

Rank
State
Total owner-occupied housing units
Percentage of homes with a mortgage
Percentage of mortgage-free homes

1

West Virginia

518,882

45.94%

54.06%

2

Mississippi

748,055

49.11%

50.89%

3

Louisiana

1,132,229

52.69%

47.31%

4

New Mexico

521,450

53.63%

46.37%

5

North Dakota

200,554

54.50%

45.50%

6

Oklahoma

962,483

54.75%

45.25%

7

Arkansas

752,399

55.31%

44.69%

8

South Dakota

233,092

55.36%

44.64%

9

Alabama

1,253,199

56.35%

43.65%

10

Florida

5,010,187

56.88%

43.12%

11

Montana

292,585

57.12%

42.88%

12

South Carolina

1,309,670

57.61%

42.39%

13

Texas

5,964,183

57.67%

42.33%

14

Wyoming

159,792

58.11%

41.89%

15

Kentucky

1,146,668

58.25%

41.75%

16

Tennessee

1,693,790

58.87%

41.13%

17

Kansas

743,508

58.99%

41.01%

18

Michigan

2,803,372

60.23%

39.77%

19

Pennsylvania

3,421,017

60.32%

39.68%

20

New York

3,930,033

60.93%

39.07%

21

Nebraska

500,086

60.96%

39.04%

22

Maine

395,809

61.47%

38.53%

23

Iowa

900,362

61.55%

38.45%

24

Vermont

178,405

61.82%

38.18%

25

Missouri

1,596,870

61.93%

38.07%

26

Ohio

3,070,181

62.78%

37.22%

27

Illinois

3,182,232

63.08%

36.92%

28

North Carolina

2,586,616

63.09%

36.91%

29

Wisconsin

1,565,599

64.12%

35.88%

30

Alaska

159,344

64.20%

35.80%

31

Hawaii

268,078

64.24%

35.76%

32

Idaho

435,493

64.36%

35.64%

33

Arizona

1,652,321

64.42%

35.58%

34

Delaware

253,948

64.61%

35.39%

35

Georgia

2,354,922

64.95%

35.05%

36

Indiana

1,765,500

65.52%

34.48%

37

New Hampshire

369,037

65.76%

34.24%

38

Oregon

1,007,015

66.78%

33.22%

39

New Jersey

2,053,929

66.96%

33.04%

40

Minnesota

1,547,594

67.13%

32.87%

41

Connecticut

898,234

68.05%

31.95%

42

Washington

1,783,549

68.82%

31.18%

43

Virginia

2,077,417

68.90%

31.10%

44

Nevada

619,309

69.01%

30.99%

45

Rhode Island

248,723

69.30%

30.70%

46

Massachusetts

1,623,515

69.94%

30.06%

47

California

7,125,090

70.54%

29.46%

48

Utah

681,563

71.06%

28.94%

49

Colorado

1,394,824

71.29%

28.71%

50

Maryland

1,472,500

72.87%

27.13%


Sources

Colin Holmes
Written by
Colin Holmes is no stranger to moving: he’s done so five times in the last five years, and he’s used his expertise to help over 185,000 readers plan their moves in the last year alone. As a former journalist and documentary interviewer, Colin brings a wealth of research experience to Move.org.