Is It More Common to Rent or Own in Each State?

The States with the Highest and Lowest Percentage of Owner-Occupied Homes
Julia Campbell
Jan 21, 2019
Icon Time To Read7 min read
Highest and Lowest States by Percentage of Owner-Occupied Homes

A yard, a few tax breaks, the ability to replace that outdated green and yellow tile in your bathroom—all reasons to buy a home.

But there are plenty of reasons to continue to rent, too. In the short run, it’s easier on the pocketbook (since you don’t have to make a five-figure down payment upfront). It relieves you from the burden of managing maintenance and repairs. And, if you’re looking to live in the heart of the Big Apple, it may be your only realistic option.

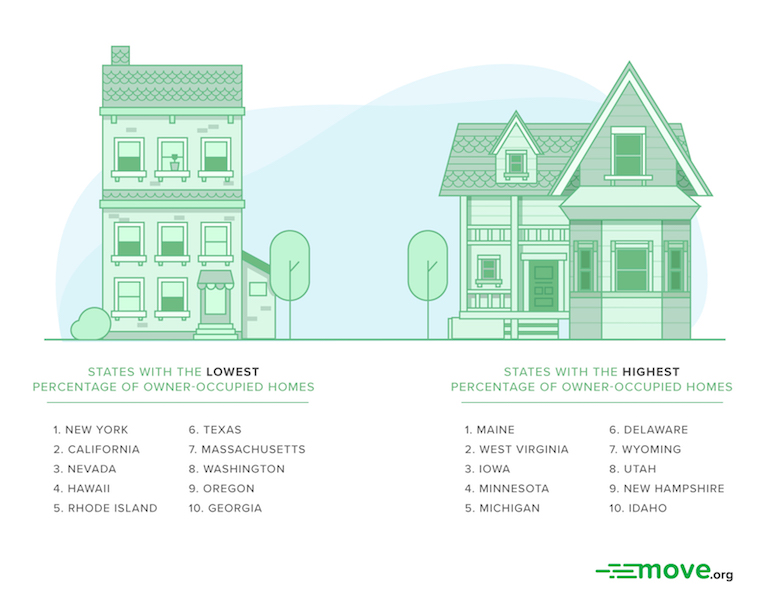
Every state in America has more owner-occupied homes than residences filled with renters, but some states are more evenly split than others. We dug up the stats to see where Americans are choosing to buy versus rent—and how much it costs them each month to keep a roof over their heads.

Map Pin
Planning on relocating?

Check out our Best Moving Companies of 2022 guide that our moving experts put together after researching professional moving companies across the country to determine the ones that can make your long-distance move the most organized, easy, and stress-free as can be.


Factors we considered

To determine which states have the highest percentage of owner-occupied homes, we looked at data on owner- and renter-occupied housing units as reported to the US Census Bureau.1

We also analyzed how much it costs Americans to pay their rent versus pay their mortgage using data from GoBankingRates. Here’s the full list of data points we gathered for each state:

  • The total number of occupied housing units
  • The percentage of owner-occupied housing units
  • The percentage of renter-occupied housing units
  • The average monthly rent
  • The average monthly mortgage payment

Learn more about how we calculated our rankings in our methodology section.


Top 10 states with the highest percentage of owner-occupied homes

#1: Maine

Maine’s average monthly rent of $1,850 seems astronomically high compared to a $1,175 monthly mortgage payment. That, along with state gems like Acadia National Park and some of the country’s best lobster, is reason enough to put a downpayment on a pad up north.

Ranking factors

  • Total occupied housing units: 540,959
  • Owner-occupied: 73%
  • Renter-occupied: 27%
  • Average monthly rent: $1,850
  • Average monthly mortgage: $1,175
  • Difference between rent and mortgage: $675

#2: West Virginia

West Virginia’s housing costs make us want to become Mountaineers. In fact, West Virginia has the lowest average mortgage payment of any state at just $778 per month. That’s also $222 less than its average monthly rent.

Ranking factors

  • Total occupied housing units: 715,308
  • Owner-occupied: 73%
  • Renter-occupied: 27%
  • Average monthly rent: $1,000
  • Average monthly mortgage: $778
  • Difference between rent and mortgage: $222

#3: Iowa

We’re big fans of Iowa’s average $895 monthly mortgage—it’s one of the lowest average mortgage payments on our list. To put things in perspective, Missouri has the lowest average rent ($985) of any US state, yet Missouri renters still pay nearly $100 more per month, on average, than Iowa homeowners.

Ranking factors

  • Total occupied housing units: 1,257,505
  • Owner-occupied: 72%
  • Renter-occupied: 28%
  • Average monthly rent: $1,089
  • Average monthly mortgage: $895
  • Difference between rent and mortgage: $194

#4: Minnesota

Like most of the states on our list with high percentages of owner-occupied homes, Minnesota’s average mortgage cost is less than its average rent—$263 less, to be exact.

In fact, even though Minnesota’s average monthly mortgage is on the higher end of housing costs in the US, it’s still cheaper than the average rent in most states. For example, North Carolina’s average rent is $1,300 compared to Minnesota’s average mortgage of $1,287.

Ranking factors

  • Total occupied housing units: 2,162,211
  • Owner-occupied: 72%
  • Renter-occupied: 28%
  • Average monthly rent: $1,550
  • Average monthly mortgage: $1,287
  • Difference between rent and mortgage: $263

#5: Michigan

If a mortgage under $900 isn’t reason enough to consider landing in Michigan, we don’t know what is. Michigan’s monthly average mortgage payment is—wait for it—less than the cost of an iPhone (and $257 cheaper than its average monthly rent).

Ranking factors

  • Total occupied housing units: 3,930,017
  • Owner-occupied: 71%
  • Renter-occupied: 29%
  • Average monthly rent: $1,150
  • Average monthly mortgage: $893
  • Difference between rent and mortgage: $257

#6: Delaware

Delaware’s average mortgage ($1,372) is less than its average rent cost—but only by twenty-eight dollars. It’s a small difference, but we’ll take a monthly mortgage payment that’s cheaper than a monthly rent check any day.

Ranking factors

  • Total occupied housing units: 357,937
  • Owner-occupied: 71%
  • Renter-occupied: 29%
  • Average monthly rent: $1,400
  • Average monthly mortgage: $1,372
  • Difference between rent and mortgage: $28

#7: Wyoming

We’re not complaining about Wyoming’s $1,025 average monthly rent—and the state’s average monthly mortgage of only $1,200 isn’t too shabby, either. With home payments less than the rent of some two-bedroom apartments in many cities, there’s one reason to check out Wyoming.

(OK, two: the state is also home to Yellowstone National Park.)

Ranking factors

  • Total occupied housing units: 225,796
  • Owner-occupied: 71%
  • Renter-occupied: 29%
  • Average monthly rent: $1,025
  • Average monthly mortgage: $1,200
  • Difference between rent and mortgage: -$175

#8: Utah

Utah has affordable real estate (though it’s getting more expensive each year) and lots of land to build on, so it’s easy to see why the state ranks high for those looking to put down roots.

With an average mortgage cost that is $306 cheaper than that of its next-door neighbor Colorado, it’s worth considering a one-way plane ticket to Utah next time you plan a ski trip.

Ranking factors

  • Total occupied housing units: 975,448
  • Owner-occupied: 70%
  • Renter-occupied: 30%
  • Average monthly rent: $1,495
  • Average monthly mortgage: $1,685
  • Difference between rent and mortgage: -$190

#9: New Hampshire

New Hampshire has a 70-to-30 ratio of owner- to renter-occupied housing units, despite the fact that the state’s average mortgage cost is $266 higher than the average monthly rent check.

Out of all fifty states, New Hampshire is one of ten where the average mortgage payment exceeds the average monthly rent.

Ranking factors

  • Total occupied housing units: 528,700
  • Owner-occupied: 70%
  • Renter-occupied: 30%
  • Average monthly rent: $1,429
  • Average monthly mortgage: $1,695
  • Difference between rent and mortgage: -$26

#10: Idaho

Potatoes and Sun Valley aren’t the only reasons to think about heading over to Idaho. With an average monthly mortgage of just $1,428—only $138 more than the state’s already-low average rent—owning a home in the 208 is certainly feasible.

Ranking factors

  • Total occupied housing units: 625,135
  • Owner-occupied: 70%
  • Renter-occupied: 30%
  • Average monthly rent: $1,290
  • Average monthly mortgage: $1,428
  • Difference between rent and mortgage: -$138

Top 10 states with the lowest percentage of owner-occupied homes

#1: New York

New York is home to the rental mecca that is New York City, so it’s no wonder the Empire State has the lowest percentage of owner-occupied homes of any US state.

New York is the only state with an average rent that exceeds $3,000. That’s nearly twice as much per month as the average mortgage payment of $1,829. Our guess: space in the Big Apple is limited—and the large number of renters drives up prices in the concrete jungle.

Ranking factors

  • Total occupied housing units: 7,304,332
  • Owner-occupied: 54%
  • Renter-occupied: 46%
  • Average monthly rent: $3,300
  • Average monthly mortgage: $1,829
  • Difference between rent and mortgage: $1,471

#2: California

If you’ve ever watched House Hunters, you know that California is an expensive place to live—period.

And it isn’t just expensive—its cities also dominate the list of competitive places to buy a home. Prime Golden State real estate in cities like San Diego, San Francisco, and Los Angeles likely contributes to the nearly even split of rented units and owner-occupied units.

For many Californian city dwellers, renting is far more doable than buying (if you consider an average monthly rental of $2,700 doable.)

Ranking factors

  • Total occupied housing units: 13,005,097
  • Owner-occupied: 55%
  • Renter-occupied: 45%
  • Average monthly rent: $2,700
  • Average monthly mortgage: $2,475
  • Difference between rent and mortgage: $225

#3: Nevada

Nevada’s percentage of owner- and renter-occupied homes splits nearly fifty-fifty (57% to 43%, to be exact)—and its average rent is only thirty-one bucks less than its average mortgage. Either way, you’ll pay a high price to live in the Silver State.

If you live in Nevada, hitting the casinos to cover your housing costs might not seem like such a bad idea.

Ranking factors

  • Total occupied housing units: 1,094,613
  • Owner-occupied: 57%
  • Renter-occupied: 43%
  • Average monthly rent: $1,430
  • Average monthly mortgage: $1,461
  • Difference between rent and mortgage: -$31

#4: Hawaii

At 59%, Hawaii has a higher percentage of owner-occupied units than New York, California, and Nevada—plus a higher average monthly mortgage.

The Aloha State is also an expensive place to rent. To put it in perspective, the average cost to rent in the 808 is more than Pennsylvania and North Carolina’s mortgage costs combined.

Ranking factors

  • Total occupied housing units: 458,078
  • Owner-occupied: 59%
  • Renter-occupied: 41%
  • Average monthly rent: $2,300
  • Average monthly mortgage: $2,839
  • Difference between rent and mortgage: -$539

#5: Rhode Island

Rhode Island has a lot going for it (hello, quaint coastal towns), but affordable housing is not one of them. In fact, rent in the smallest state is almost $600 more than in the largest state (a.k.a. Texas).

Ranking factors

  • Total occupied housing units: 408,748
  • Owner-occupied: 61%
  • Renter-occupied: 39%
  • Average monthly rent: $2,100
  • Average monthly mortgage: $1,444
  • Difference between rent and mortgage: $656

#6: Texas

Everything is bigger in Texas—including housing costs. With an average rent of $1,525 and an average mortgage of $1,340, the Lone Star State has an average rent and mortgage fairly in line with each other.

In Texas, it’s pricey to be a renter and an owner.

Ranking factors

  • Total occupied housing units: 9,623,874
  • Owner-occupied: 62%
  • Renter-occupied: 38%
  • Average monthly rent: $1,525
  • Average monthly mortgage: $1,340
  • Difference between rent and mortgage: $185

#7: Massachusetts

Massachusetts’s $2,700 average monthly rent comes at no surprise with Boston and Cambridge in the mix. Its average monthly mortgage of $2,114 isn’t much better. Like Rhode Island, the Bay State proves that living in New England isn’t a cheap endeavor.

Ranking factors

  • Total occupied housing units: 2,604,954
  • Owner-occupied: 62%
  • Renter-occupied: 38%
  • Average monthly rent: $2,700
  • Average monthly mortgage: $2,114
  • Difference between rent and mortgage: $586

#8: Washington

Like the Northeast, living in the Northwest costs a pretty penny—and Washington is no exception. With an average rent of almost $2,000 per month, Washington even beats out Oregon (the next state on our list).

Ranking factors

  • Total occupied housing units: 2,840,377
  • Owner-occupied: 63%
  • Renter-occupied: 37%
  • Average monthly rent: $1,995
  • Average monthly mortgage: $1,729
  • Difference between rent and mortgage: $266

#9: Oregon

Like Washington, Oregon’s housing costs are sky high. The state’s average mortgage and rental rates are both in the $1,700s, proving that living on the coast is pricey no matter your method of housing.

Ranking factors

  • Total occupied housing units: 1,603,635
  • Owner-occupied: 63%
  • Renter-occupied: 37%
  • Average monthly rent: $1,725
  • Average monthly mortgage: $1,793
  • Difference between rent and mortgage: -$68

#10: Georgia

Surprised to see that Georgia made the list of states with low percentages of owner-occupied homes? Us too. Turns out rental leases prevail over property deeds in the Peach State.

That said, Georgia’s $159 difference between its average monthly rent and its average monthly mortgage is fairly small compared to other states with low owner-occupied percentages. Only Oregon, Nevada, and Texas have tighter margins.

Ranking factors

  • Total occupied housing units: 3,745,074
  • Owner-occupied: 63%
  • Renter-occupied: 37%
  • Average monthly rent: $1,380
  • Average monthly mortgage: $1,221
  • Difference between rent and mortgage: $159

Your next move

Company
Company type
Move.org rating
Packing & loading services
Pricing
Discounts
Learn more
Professional mover
4.8 out of 5 stars
4.8
Icon Yes  LightYes
$$$
Icon Yes  Light10% Move.org discount, military personnel, seniors
Professional mover
4.5 out of 5 stars
4.5
Icon Yes  LightYes
$$$
Icon No  LightNone
Professional mover
4.8 out of 5 stars
4.8
Icon Yes  LightYes
$$$
Icon Yes  LightSeniors
Moving container company
4.6 out of 5 stars
4.6
Icon No  LightNo
$$
Icon Yes  Light10% Move.org discount, military personnel
Moving container company
4.5 out of 5 stars
4.5
Icon No  LightNo
$$
Icon Yes  LightMove.org readers, military personnel

Thinking of renting or buying? Use our writeup on best interstate moving companies to get the ball rolling on your next move!


Methodology

To determine which states have the highest percentage of owner-occupied homes, Move.org looked at the US Census Bureau’s 2017 American Community Survey. We compared each state’s percentage of owner-occupied housing units to the percentage of renter-occupied housing units.

The US Census Bureau defines owner-occupied housing units as units in which the property owner or co-owner reside. Renter-occupied housing units, on the other hand, are not occupied by the property owner. This category includes renters as well as properties occupied by friends or relatives of the owner, caretakers, and other service providers.

Although we didn’t include additional data in our ranking criteria, we also looked at each state's average monthly rent, average monthly mortgage, and total number of occupied housing units.

We compiled each state’s average rent and mortgage costs using data from GoBankingRates. Average monthly mortgage costs assume a 20% down payment with a 30-year fixed loan.


Complete state rankings for owner-occupied homes

State
Percentage of Owner-Occupied Units

Maine

73.17

West Virginia

72.54

Iowa

71.60

Minnesota

71.57

Michigan

71.33

Delaware

70.95

Wyoming

70.77

Utah

69.87

New Hampshire

69.80

Idaho

69.66

Vermont

69.52

Montana

69.15

Indiana

69.04

South Carolina

68.75

Mississippi

68.50

Pennsylvania

68.30

Alabama

68.05

New Mexico

67.92

South Dakota

67.71

Missouri

66.95

Maryland

66.71

Wisconsin

66.61

Virginia

66.57

Kentucky

66.47

Nebraska

66.28

Connecticut

66.20

Illinois

66.18

Kansas

65.86

Ohio

65.78

Oklahoma

65.46

Tennessee

65.43

North Carolina

65.40

Arkansas

65.25

Colorado

65.20

Louisiana

65.18

Florida

65.15

Arizona

64.72

New Jersey

63.81

Alaska

63.55

North Dakota

63.41

Georgia

62.88

Oregon

62.80

Washington

62.79

Massachusetts

62.32

Texas

61.97

Rhode Island

60.85

Hawaii

58.52

Nevada

56.58

California

54.79

New York

53.80


Sources

  1. US Census Bureau, “American Community Survey
  2. GoBankingRates, “Cost of Renting vs Owning a Home in Every State
Julia Campbell
Written by
Julia Campbell
Julia Campbell is a full-time writer who knows the tricks of the trade when it comes to planning a hassle-free move. Having moved seven times in the past five years, she draws from her own experience and industry expertise to help you avoid her biggest mistakes (like that time she thought she could get away with packing her dishes without wrapping them first).