The Average Cost of Owning a Car in the US

Joe Roberts
Feb 15, 2021
Icon Time To Read3 min read
Average car costs

According to our data, it costs roughly $5,264.58 every year to own a car in the United States. This includes the average costs for car payments, gas, car insurance, and replacement parts across every state in the country—some of which have much higher costs than others.

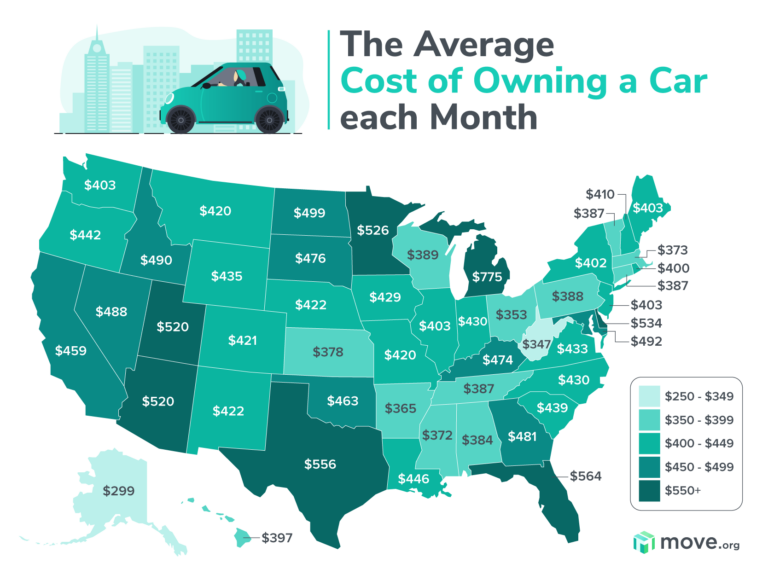
For example, the average Michigan resident pays $9,304.28 every year for their car, while the average Alaskan only pays $3,586.95. This is a difference of nearly $6000, so if you’re thinking of moving to a new state and you want to know how much it costs to own a car there, you should look into that state’s unique costs instead of planning to pay the national average.

To help with this, we’ve broken down the data to show you which states have the highest and lowest average prices for car ownership.

Keep reading to learn how much owning a car can cost in different states. We’ll also share a few interesting facts we found in the data.


Map Pin
Planning on relocating?

Check out our Best Moving Companies of 2022 guide that our moving experts put together after researching professional moving companies across the country to determine the ones that can make your long-distance move the most organized, easy, and stress-free as can be.


States with the highest annual costs for owning a car

A car is basically a must-have for any American adult. This is partly because many American cities were designed or updated with cars in mind. Additionally, public transportation in US cities is far less developed and accessible than cities in other countries with comparable wealth, geography, and population density.1

So, if you live in the US and want to travel to work, get out of the house for recreation, or go grocery shopping, you probably need a car.

Unfortunately, owning a car can cost quite a bit, especially in these states.

States where it costs the most to own a car

Rank
State
Monthly cost to own a car
Annual cost to own a car

1

Michigan

$775

$9,304.28

2

Florida

$564

$6,765.22

3

Texas

$556

$6,670.51

4

Delaware

$534

$6,404.80

5

Minnesota

$526

$6,317.65

6

Arizona

$520

$6,243.41

7

Utah

$520

$6,239.79

8

North Dakota

$499

$5,991.20

9

Maryland

$492

$5,905.71

10

Idaho

$490

$5,878.09


States with the lowest annual costs for owning a car

Owning a car isn’t cheap no matter where you live. Even the cheapest used car you can find will need insurance, fuel, and routine maintenance. That said, there are some states where it costs less than $5,000 on average to own a car and keep it running for a year.

Here are the states where car ownership costs the least.

States where it costs the least to own a car

Rank
State
Monthly cost to own a car
Annual cost to own a car

1

Alaska

$299

$3,586.95

2

West Virginia

$347

$4,166.85

3

Ohio

$353

$4,235.17

4

Arkansas

$365

$4,379.89

5

Mississippi

$372

$4,461.13

6

Massachusetts

$373

$4,480.48

7

Kansas

$378

$4,531.79

8

Alabama

$384

$4,610.43

9

Tennessee

$387

$4,639.37

10

Vermont

$387

$4,642.13

Light Bulb
Thinking of moving?

If you’re looking into car ownership costs in different states because you’re planning to move, check out our list of the best auto transporters to find a company that will ship your car. Also, you can read our moving paperwork checklist for some tips on getting a new driver’s license and transferring your vehicle registration to your new state.


Interesting findings

Gas costs more on the West Coast

When we wrote this article, the average cost for a gallon of gas in California was $3.39. While this might not seem too bad to anyone who remembers 2008, it’s currently the highest in the country, and it's almost exactly a dollar higher than the national average of $2.40.

Washington and Oregon also had some of the highest fuel costs in the country with average gas prices set at $2.82 and $2.69, respectively.

People in Wyoming drive more than residents in any other state

We found that the average American drives roughly 14,814.3 miles every year. Wyoming residents blow this number out of the water, though, by driving 21,821 miles annually. This makes them the Americans that drive the most.

Fun fact: since the average Wyoming resident pays an average of $5,216.54 annually to own a car, they pay about 24 cents for every mile they drive.

Michigan residents pay the most for car insurance

On average, Americans pay $882 annually for the minimum state-required car insurance. Compared to this, Michigan’s minimum insurance cost of $5,740 seems incredibly expensive. In fact, this high insurance price is what puts Michigan in the number one spot on our list of states where residents pay the most for their cars.

Texans spend the most on car payments

You know what they say: everything’s bigger in Texas. Evidently, that also applies to car payments. Between paying off their auto loans and buying replacement parts, the average Texan spends $4,145 every year on their car, the highest price on our list. This equates to roughly $345.41 every month.

Ready to move?

Company
Company type
Move.org rating
Packing & loading services
Pricing
Discounts
Learn more
Professional mover
4.8 out of 5 stars
4.8
Icon Yes  LightYes
$$$
Icon Yes  Light10% Move.org discount, military personnel, seniors
Professional mover
4.5 out of 5 stars
4.5
Icon Yes  LightYes
$$$
Icon No  LightNone
Professional mover
4.8 out of 5 stars
4.8
Icon Yes  LightYes
$$$
Icon Yes  LightSeniors
Moving container company
4.6 out of 5 stars
4.6
Icon No  LightNo
$$
Icon Yes  Light10% Move.org discount, military personnel
Moving container company
4.5 out of 5 stars
4.5
Icon No  LightNo
$$
Icon Yes  LightMove.org readers, military personnel

Methodology

To get our rankings, we compared the following data for each state in the US:

  • The average price of gas2 multiplied by the number of miles driven by the average resident3 divided by the average miles-per-gallon rating for light-duty vehicles4
  • The price of the minimum car insurance required by the state5
  • Average expenditures for car payments and replacement parts6
  • Title and registration fees7

Our data doesn’t include costs for repair work from professional mechanics, nor does it include costs that are unique to owning electric vehicles.

Sources

  1. Vox, “The real reason American public transportation is such a disaster.” Updated August 10, 2015. Accessed February 8, 2021.
  2. GasBuddy, “Average Regular Gas Price Comparison by State.” Accessed February 9, 2021.
  3. Federal Highway Administration, “Population, Drivers, Vehicles, Fuel and Travel by State.” Accessed February 9, 2021.
  4. United States Department of Transportation, “Average Fuel Efficiency of U.S. Light-Duty Vehicles.” Accessed February 9, 2021.
  5. ValuePenguin, “Average Cost of Car Insurance (February 2021).” Updated February 5, 2021. Accessed February 9, 2021.
  6. Bureau of Economic Analysis, “Regional Data.” Accessed February 9, 2021.
  7. World Population Review, “Car Registration Fees by State 2021.” Accessed February 9 2021.

Complete data set

Rank
State
Total
Average gas price per gallon
Miles driven per licensed driver
Annual fuel cost per driver
Annual minimum car insurance costs
Annual cost for cars and parts per licensed driver
Registration and title fees

1

Michigan

$9,304.28

$2.37

14,121

$1,499.49

$5,740

$2,005

$60

2

Florida

$6,765.22

$2.43

11,836

$1,289.75

$2,361

$2,889

$225

3

Texas

$6,670.51

$2.11

16,347

$1,548.20

$926

$4,145

$52

4

Delaware

$6,404.80

$2.44

14,802

$1,622.25

$1,200

$3,543

$40

5

Minnesota

$6,317.65

$2.30

17,887

$1,840.84

$1,043

$3,409

$25

6

Arizona

$6,243.41

$2.42

14,493

$1,572.13

$1,234

$3,420

$17

7

Utah

$6,239.79

$2.31

15,442

$1,599.60

$909

$3,672

$60

8

North Dakota

$5,991.20

$2.29

15,725

$1,611.28

$512

$3,819

$49

9

Maryland

$5,905.71

$2.46

14,834

$1,636.40

$1,081

$3,053

$135

10

Idaho

$5,878.09

$2.34

15,318

$1,604.61

$559

$3,655

$60

11

Nevada

$5,859.11

$2.76

12,869

$1,592.18

$1,033

$3,185

$49

12

Georgia

$5,772.86

$2.23

18,920

$1,888.61

$683

$3,181

$20

13

South Dakota

$5,707.05

$2.34

15,505

$1,628.37

$424

$3,619

$36

14

Kentucky

$5,684.56

$2.25

17,370

$1,753.36

$1,549

$2,357

$25

15

Oklahoma

$5,551.61

$2.13

18,891

$1,802.69

$611

$3,042

$96

16

California

$5,503.28

$3.39

14,435

$2,196.32

$614

$2,607

$86

17

Louisiana

$5,357.35

$2.14

14,805

$1,418.09

$1,128

$2,791

$20

18

Oregon

$5,301.26

$2.69

14,032

$1,693.91

$1,050

$2,445

$112

19

South Carolina

$5,263.44

$2.16

16,020

$1,548.84

$939

$2,736

$40

20

Wyoming

$5,216.54

$2.23

21,821

$2,183.08

$410

$2,593

$30

21

Virginia

$5,197.05

$2.32

15,464

$1,605.34

$618

$2,898

$76

22

Indiana

$5,161.08

$2.39

17,821

$1,905.97

$488

$2,666

$101

23

North Carolina

$5,160.08

$2.29

15,729

$1,613.10

$445

$3,068

$34

24

Iowa

$5,146.91

$2.34

15,074

$1,581.08

$408

$2,962

$196

25

New Mexico

$5,063.78

$2.27

18,369

$1,868.20

$570

$2,567

$59

26

Nebraska

$5,061.34

$2.38

15,128

$1,611.84

$487

$2,926

$36

27

Colorado

$5,057.31

$2.32

13,443

$1,397.35

$865

$2,735

$60

28

Missouri

$5,044.69

$2.15

17,396

$1,679.53

$690

$2,646

$29

29

Montana

$5,038.01

$2.31

14,556

$1,507.17

$466

$2,848

$217

30

New Hampshire

$4,919.99

$2.35

12,931

$1,360.94

$745

$2,790

$24

31

Illinois

$4,839.49

$2.57

12,921

$1,490.26

$854

$2,426

$69

32

Washington

$4,835.84

$2.82

12,837

$1,622.18

$569

$2,615

$30

33

New Jersey

$4,834.13

$2.56

11,927

$1,368.66

$812

$2,594

$60

34

Maine

$4,832.06

$2.43

15,420

$1,683.06

$445

$2,644

$60

35

New York

$4,826.28

$2.49

11,871

$1,326.04

$1,373

$2,100

$27

36

Rhode Island

$4,804.64

$2.40

12,781

$1,374.96

$1,375

$2,010

$45

37

Hawaii

$4,766.99

$3.26

11,104

$1,622.78

$644

$2,455

$45

38

Wisconsin

$4,667.89

$2.26

15,188

$1,537.19

$515

$2,564

$52

39

Pennsylvania

$4,654.05

$2.72

12,435

$1,516.74

$587

$2,513

$37

40

Connecticut

$4,645.71

$2.46

11,595

$1,277.53

$1,165

$2,115

$88

41

Vermont

$4,642.13

$2.40

13,458

$1,450.81

$535

$2,616

$41

42

Tennessee

$4,639.37

$2.22

15,462

$1,539.27

$509

$2,562

$29

43

Alabama

$4,610.43

$2.18

16,054

$1,569.40

$669

$2,272

$100

44

Kansas

$4,531.79

$2.20

14,742

$1,453.71

$583

$2,456

$39

45

Massachusetts

$4,480.48

$2.38

11,759

$1,256.05

$721

$2,468

$35

46

Mississippi

$4,461.13

$2.09

17,699

$1,661.96

$734

$2,047

$19

47

Arkansas

$4,379.89

$2.18

14,974

$1,464.50

$554

$2,353

$8

48

Ohio

$4,235.17

$2.33

12,906

$1,347.90

$528

$2,325

$35

49

West Virginia

$4,166.85

$2.34

14,283

$1,498.11

$627

$1,967

$75

50

Alaska

$3,586.95

$2.57

9,915

$1,142.23

$491

$1,929

$24

Joe Roberts
Written by
Joe Roberts
Joe Roberts is a professional writer with a degree in writing studies and over four years of copywriting experience. He previously worked at Overstock.com, where he wrote about furniture, home decor, and moving. Joe has moved all over Utah, so he knows his way around a moving truck—and he spends his time (and money) expanding his personal library so it will be even heavier next time he moves.