To find out where people pay the most for food every month, we looked at grocery costs in each state’s most populous city.
The Average Cost of Food in the US in 2025
movers helped every month
20k
moving grants awarded
24
moving companies evaluated
156
years of expert experience
80+
For over 8 years Move.org experts have examined pricing, credentials, and real customer reviews to give you (human) recommendations you can trust. See how we review.
The data in this map is based on 2025 numbers. See methodology for more details.
The average cost of groceries in America in 2025 is $370 per month per person.1 However, this number can vary greatly depending on factors like age and personal eating habits. Location is another important—though potentially surprising—factor in determining food costs. Groceries cost more in some US cities and states than others.
To find out where people pay the most for food every month, we looked at grocery costs in each state’s most populous city. We found that residents in the Kahului-Wailuku-Lahaina area of Hawaii pay the most for food every month ($536 per person), while people living in Butler County, Kentucky pay the least ($285 per person).
Keep reading to learn more about food costs across the country and to see where your state ranks.
Food assistance resources for those who rely on SNAP benefits for groceries
Snap Into Action: You can request help or offer help in your local community.
Feeding America Network: Search for food banks and food pantries by zip code.
List of food assistance resources from Good Morning America.
Key findings
- The average Kahului-Wailuku-Lahaina resident pays $536.40 for groceries every month, more than anyone else in the US.
- People in Hawaii spend nearly 35% more on food than the average American.
- In addition to Hawaii, four other states face food costs that are at least 10% higher than the national average: Alaska (19.73%), Rhode Island (13.78%), Vermont (12.97%), and Massachusetts (10.27%).
- An area’s population size doesn’t seem to greatly influence food costs. Densely populated cities and smaller metros both show up evenly throughout our rankings.
- States with lower average food costs tend to be located in the south and Midwest, while states with higher average food costs tend to be located along the west coast and in New England.
- On average, grocery bills account for 8%–11% of a household's monthly expenses (including housing, transportation, healthcare, utilities, taxes, childcare, and other necessities).
- The typical American family spends $169 on food per child per month.
Planning on relocating?
Check out our Best Moving Companies guide that our moving experts put together after researching professional moving companies across the country. Make your move as organized, easy, and stress-free as it can be.
Locations with the highest and lowest food costs in the U.S.
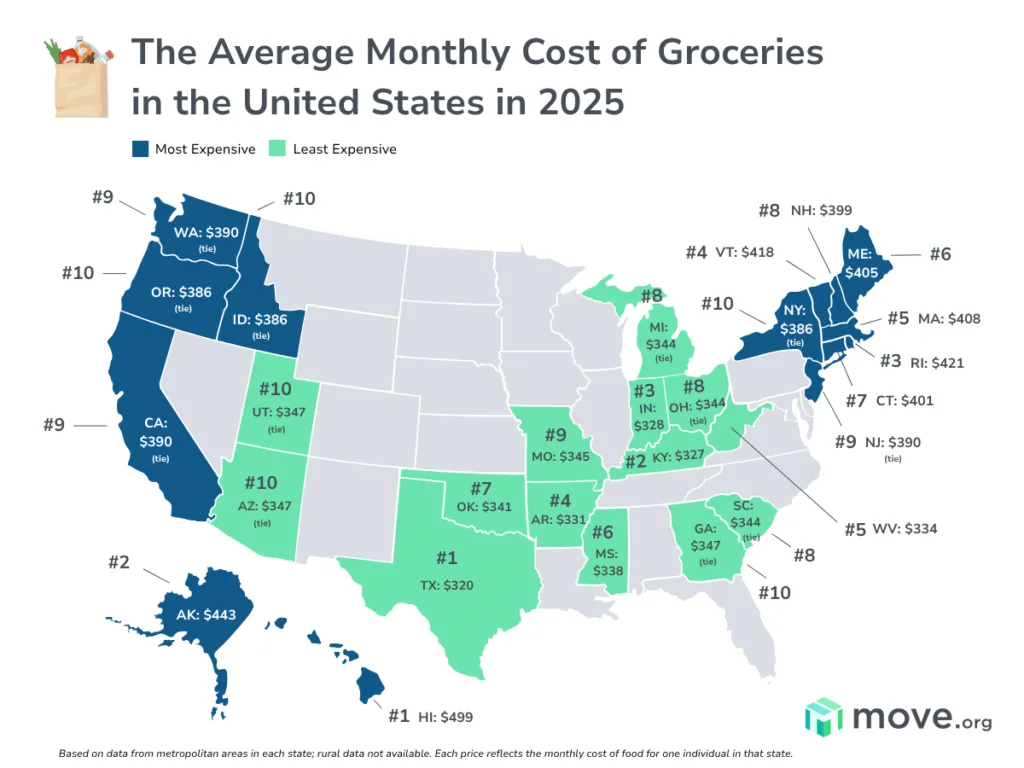
The following averages are based on data from metropolitan areas in each state. We do not currently have data on rural food prices and spending.
Each price reflects the average monthly cost of food for one individual in that state.
States with the highest food costs
- Hawaii: $499
- Alaska: $443
- Rhode Island: $421
- Vermont: $418
- Massachusetts: $408
- Maine: $405
- Connecticut: $401
- New Hampshire: $399
- (TIE) New Jersey, California, and Washington: $390
- (TIE) Oregon, New York, and Idaho: $386
States with the lowest food costs
- Texas: $320
- Kentucky: $327
- Indiana: $328
- Arkansas: $331
- West Virginia: $334
- Mississippi: $338
- Oklahoma: $341
- (TIE) South Carolina, Michigan, and Ohio: $344
- Missouri: $345
- (TIE) Georgia, Utah, and Arizona: $347
What about other monthly costs?
Grocery bills are some of the biggest monthly bills most people accrue, but they’re far from the only monthly cost you need to plan for. Get a handle on budgeting your monthly bills by reading our average utility costs guide.
U.S. metros with the highest food costs
- Kahului-Wailuku-Lahaina, Hawaii: $536
- Butte County, Idaho: $492
- San Francisco, California: $480
- Honolulu, Hawaii: $461
- Peach County, Georgia: $460
- Barnstable Town, Massachusetts: $459
- Santa Cruz-Watsonville, California: $457
- Napa, California: $454
- Matanuska-Susitna Borough, Alaska: $451
- San Benito County, California: $449
U.S. metros with the lowest food costs
- Butler County, Kentucky: $285
- Washington County, Indiana: $286
- Grant County, Kentucky: $291
- Union County, Indiana: $292
- Poinsett County, Arkansas: $294
- (TIE) Victoria, Texas and Clarendon County, South Carolina: $295
- (TIE) Lampasas County, Texas and Atacosa County, Texas: $296
- (TIE) Sullivan County, Indiana, Lincoln County, Georgia, Chester County, South Carolina, and McAllen-Edinburg-Mission, Texas: $298
Save money on groceries
Do you have SNAP benefits? Did you know that you can buy groceries with SNAP EBT cards on Amazon? No Prime membership required.
Are you a Prime member? You can save money when ordering grocery staples on Amazon when you opt to "Subscribe and save," or "stock up and save."
Certain content that appears on this site comes from Amazon. This content is provided “as is” and is subject to change or removal at any time. Product prices and availability are accurate as of the date/time indicated and are subject to change. Any price and availability information displayed on Amazon at the time of purchase will apply to the purchase of this product. Move.org utilizes paid Amazon links.
Food costs across the US
Methodology
We collected housing, food, transportation, healthcare, other necessities, and taxes from the Economic Policy Institute (EPI) by metro area. EPI bases its food cost data from the US Department of Agriculture's national low-cost food plan and adjusts the costs based on information from Feeding America's map and Meal Gap data.
To get the prices closer to current day pricing we applied a 3% increase to all values as reported by the Bureau of Labor Statistics increase in cost of living from September 2024 to September 2025 For Utilities, we use our own Utilities 101 data by state and applied to the metro areas. Ranking is then applied from least expensive to most expensive area by family size and for all family sizes and areas.
Additional food costs like restaurant bills were not included in these prices. Costs reflect how much food is required for a nutritional diet.
Sources
- Cost of Living Data, Economic Policy Institute Family Budget Calculator
- Consumer Price Index, Bureau of Labor Statistics (2025)
- Utility Bills 101, Move.org (2025)