The Best US Cities for Beer Lovers in 2021

Joe Roberts
Aug 13, 2021
Icon Time To Read2 min read
Best cities for beer lovers across the US

Whether you’re a connoisseur of craft beers or you just enjoy cracking open a cold one after a long day of work, having a lot of local breweries to keep your fridge stocked with tasty new lagers, stouts, and IPAs is probably important to you.

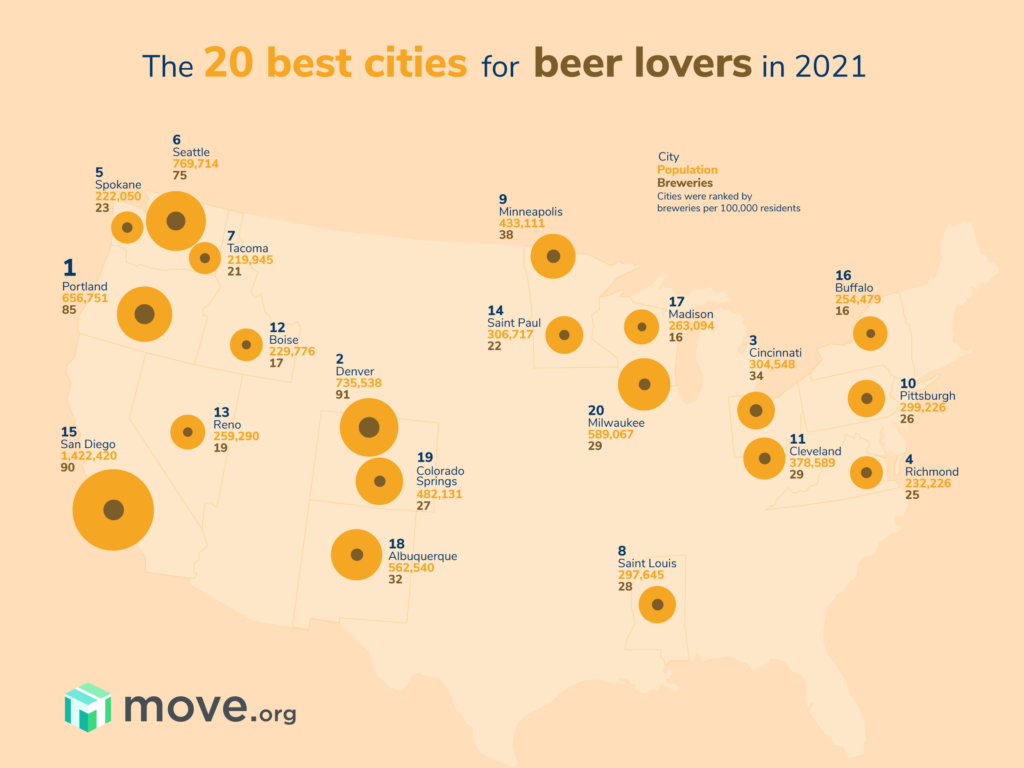
To find out which cities are the best for beer lovers to live in or visit, we ranked the US’ most populous cities based on how many breweries they have per capita. If you’re thinking about moving to a new locale or you’re just looking for a fun road trip destination, our list can help you find the best places for beer lovers like you.

Keep reading to find out which cities are the US’ beer capitals and to see where your city ranks.

Map Pin
Planning on relocating?

Check out our Best Moving Companies of 2021 guide that our moving experts put together after researching professional moving companies across the country to determine the ones that can make your long-distance move the most organized, easy, and stress-free as can be


Key findings

  • With three cities in our top 10, Washington is one of the best states for beer lovers.
  • Denver, Colorado has more breweries than any other city in the US. However, Portland, Oregon has more breweries per capita, making it our number one city for beer connoisseurs.
  • Some of the biggest cities in the US—like New York and Los Angeles—have relatively few breweries per capita, landing them in our bottom 10.

The best and worst cities for beer lovers

Cities with the most breweries per capita

  1. Portland, OR:
    85 breweries
    12.94 breweries per 100,000 residents
  2. Denver, CO:
    91 breweries
    12.37 breweries per 100,000 residents
  3. Cincinnati, OH:
    34 breweries
    11.16 breweries per 100,000 residents
  4. Richmond, VA:
    25 breweries
    10.77 breweries per 100,000 residents
  5. Spokane, WA:
    23 breweries
    10.36 breweries per 100,000 residents
  6. Seattle, WA:
    75 breweries
    9.74 breweries per 100,000 residents
  7. Tacoma, WA:
    21 breweries
    9.55 breweries per 100,000 residents
  8. Saint Louis, MO:
    28 breweries
    9.41 breweries per 100,000 residents
  9. Minneapolis, MN:
    38 breweries
    8.77 breweries per 100,000 residents
  10. Pittsburgh, PA:
    26 breweries
    8.69 breweries per 100,000 residents

Cities with the fewest breweries per capita

  1. North Las Vegas, NV:
    0 breweries
    0 breweries per 100,000 residents
  2. Laredo, TX:
    0 breweries
    0 breweries per 100,000 residents
  3. New York, NY:
    13 breweries
    0.16 breweries per 100,000 residents
  4. Newark, NJ:
    1 brewery
    0.35 breweries per 100,000 residents
  5. Chesapeake, VA:
    1 brewery
    0.4 breweries per 100,000 residents
  6. Hialeah, FL:
    1 brewery
    0.43 breweries per 100,000 residents
  7. Los Angeles, CA:
    23 breweries
    0.58 breweries per 100,000 residents
  8. El Paso, TX:
    4 breweries
    0.59 breweries per 100,000 residents
  9. Irvine, CA
    2 breweries
    0.7 breweries per 100,000 residents
  10. Arlington, TX:
    3 breweries
    0.75 breweries per 100,000 residents

Methodology

For our research, we looked at the 100 most populous cities in the United States according to the U.S Census Bureau.1 We then compared each city’s population to how many breweries it has. We sourced our brewery numbers from Open Brewery DB,2 a community-driven database that gathers public information about breweries.

We ranked cities based on how many breweries they have per 100,000 residents. Other factors like the output of a given brewery or the quality and popularity of its beers were not used for our rankings.


Breweries per capita in the US’ most populous cities

Rank
City
Population
Breweries
Breweries per 100,000 residents
1Portland, Oregon656,7518512.94
2Denver, Colorado735,5389112.37
3Cincinnati, Ohio304,5483411.16
4Richmond, Virginia232,2262510.77
5Spokane, Washington222,0502310.36
6Seattle, Washington769,714759.74
7Tacoma, Washington219,945219.55
8Saint Louis, Missouri297,645289.41
9Minneapolis, Minnesota433,111388.77
10Pittsburgh, Pennsylvania299,226268.69
11Cleveland, Ohio378,589297.66
12Boise, Idaho229,776177.4
13Reno, Nevada259,290197.33
14Saint Paul, Minnesota306,717227.17
15San Diego, California1,422,420906.33
16Buffalo, New York254,479166.29
17Madison, Wisconsin263,094166.08
18Albuquerque, New Mexico562,540325.69
19Colorado Springs, Colorado482,131275.6
20Milwaukee, Wisconsin589,067294.92
21Austin, Texas995,484494.92
22Anchorage, Alaska287,095144.88
23Raleigh, North Carolina474,414234.85
24Orlando, Florida289,457144.84
25Anaheim, California353,676174.81
26Tampa, Florida407,599194.66
27Atlanta, Georgia512,550234.49
28Saint Petersburg, Florida267,802124.48
29San Francisco, California866,606384.38
30Kansas City, Missouri497,159214.22
31Scottsdale, Arizona262,647114.19
32Lincoln, Nebraska290,505124.13
33Sacramento, California512,838214.09
34Indianapolis, Indiana877,903333.76
35Norfolk, Virginia242,80393.71
36Lexington, Kentucky324,735123.7
37Columbus, Ohio903,852333.65
38Oakland, California424,891153.53
39Charlotte, North Carolina900,350313.44
40Tucson, Arizona553,571193.43
41Baltimore, Maryland586,131203.41
42Miami, Florida471,525163.39
43New Orleans, Louisiana389,476133.34
44Nashville, Tennessee671,295223.28
45Louisville, Kentucky618,338203.23
46Tulsa, Oklahoma403,166133.22
47Durham, North Carolina285,89793.15
48Riverside, California330,786103.02
49Greensboro, North Carolina297,87893.02
50Fort Wayne, Indiana272,39882.94
51Honolulu, Hawaii341,555102.93
52Winston Salem, North Carolina248,11272.82
53Wichita, Kansas391,731112.81
54Omaha, Nebraska478,393132.72
55Virginia Beach, Virginia451,231122.66
56Aurora, Colorado387,377102.58
57Chicago, Illinois2,677,643642.39
58Chandler, Arizona265,39862.26
59Washington DC712,816162.24
60Long Beach, California454,681102.2
61Henderson, Nevada329,17272.13
62Oklahoma City, Oklahoma662,314142.11
63Las Vegas, Nevada662,368131.96
64Detroit, Michigan665,369131.95
65Gilbert, Arizona257,65851.94
66Toledo, Ohio271,45551.84
67Corpus Christi, Texas327,24861.83
68Jacksonville, Florida920,570161.74
69Boston, Massachusetts691,531111.59
70Glendale, Arizona255,30741.57
71Memphis, Tennessee649,705101.54
72Lubbock, Texas262,61141.52
73Santa Ana, California331,30151.51
74Fresno, California530,26781.51
75Dallas, Texas1,343,266201.49
76San Jose, California1,013,616151.48
77Chula Vista, California272,97941.47
78Philadelphia, Pennsylvania1,578,487231.46
79Houston, Texas2,316,120311.34
80Fort Worth, Texas927,720121.29
81Fremont, California234,56931.28
82San Antonio, Texas1,567,118191.21
83Phoenix, Arizona1,708,127181.05
84Bakersfield, California385,72541.04
85Plano, Texas291,29631.03
86Stockton, California312,71630.96
87Mesa, Arizona528,15950.95
88Garland, Texas238,13920.84
89Irving, Texas240,91620.83
90Jersey City, New Jersey262,66420.76
91Arlington, Texas398,86430.75
92Irvine, California283,70020.7
93El Paso, Texas681,53440.59
94Los Angeles, California3,970,219230.58
95Hialeah, Florida232,03710.43
96Chesapeake, Virginia247,01110.4
97Newark, New Jersey282,52010.35
98New York, New York8,253,213130.16
99Laredo, Texas263,6400.00.0
99North Las Vegas, Nevada260,0980.00.0

Sources

  1. United States Census Bureau, “City and Town Population Totals: 2010-2019.” Accessed July 20, 2021.
  2. Open Brewery DB, “Welcome to Open Brewery DB.” Accessed July 20, 2021.
Joe Roberts
Written by
Joe Roberts
Joe Roberts is a professional writer with a degree in writing studies and over four years of copywriting experience. He previously worked at Overstock.com, where he wrote about furniture, home decor, and moving. Joe has moved all over Utah, so he knows his way around a moving truck—and he spends his time (and money) expanding his personal library so it will be even heavier next time he moves.