

The cost of living continues to rise, but is income keeping up with home values? Median home prices have increased 68% since 1975. Meanwhile, median income has gone up only 26%—that’s a 42-percentage-point discrepancy that isn’t in the buyer’s favor.
Home Values Have Increased by 68%—Can Income Keep Up?
Why you can trust Move.org
movers helped every month
20k
moving grants awarded
24
moving companies evaluated
156
years of expert experience
80+
For over 8 years, Move.org experts have examined pricing, credentials, and real customer reviews to give you (human) recommendations you can trust. See how we review.
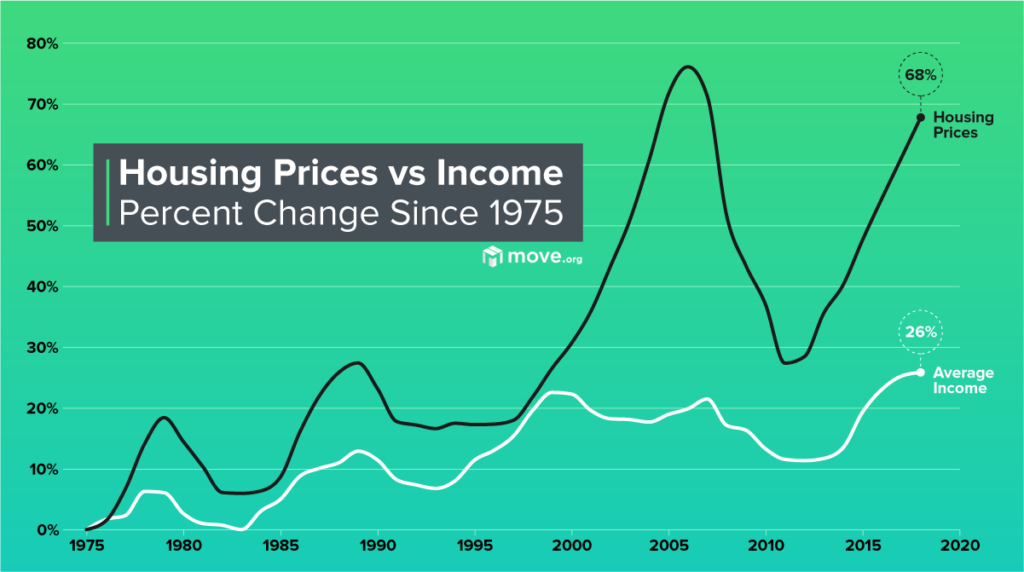
We compared the increase of median home values for single families to the increase in income across the past four decades (1975 to 2018).
Neither home values nor income levels are lower today than they were in 1975, but the peaks and valleys indicate there's a rhythm to the increase over the years. One clear pattern is that income increases have never been able to quite follow along with the housing market.
Home values and income increases since 1975
We used 1975 as a baseline year and looked at the changes from 1980 up until the most recent decade. When comparing the median single-home value against median income, we found the percentage increase of each and then compared them in percentage points.
*Since 1975, when the median single-family home value was $155,573 and the median income was $50,214. All figures were adjusted for 2018 dollars.
At its closest point across the decades, the difference between housing cost increases and income increases was just over 8 percentage points. At its furthest, we’re looking at a 42-point difference.
Our takeaway? Homebuyers face a lot of fluctuation in affordability.
Planning on relocating?
Check out our Best Moving Companies guide that our moving experts put together after researching professional moving companies across the country. Make your move as organized, easy, and stress-free as it can be.
When were incomes closest to home prices?
If we’re looking strictly at median home values against median incomes, the ’90s was the decade when homes were most affordable. The median income as a percentage of the median home value in the 1990s was 30%—compare that to the 2000s, when income comprised just 25% of home value.
Income compared to home prices over the decades
*Decade average.
Remember, this doesn’t account for cost of living increases, debt, or taxes. Home buying is a serious matter, and you need to include as many variables as you can before committing to a purchase.
What was the best decade to buy a house?
A home is an investment. The 68% increase in home prices since 1975 shows that even when bubbles burst and growth trends downward, it’s cheaper to get in early and sell it down the road (assuming you didn’t buy your dream home with plans to live mortgage-free).
But if your income isn’t increasing to match, it makes it harder to afford a home as time goes on.
Beginning and end of decades compared
The ’80s as a whole showed stable growth in both home values and income. In the ’90s, income actually grew more compared to the previous decade than home values did (nearly 10% versus just under 3%). Housing prices stabilized for a short period.
The housing market flew away from income increases during the 2000s. The median home value finished the decade only about 5% ahead of where it started. Meanwhile, incomes dipped down a whopping 7%.
Difference in home values and income between decades
Finally, 2010–2018 saw a 22% increase in home prices but only an 11% rise in income from the start of the decade.
The bottom line
Buying a home has never been cheap, and it’s one of the most significant investments you can make.
No one can predict precisely when the markets will be better for buyers or sellers, but one thing is clear: prices for homes generally rise over decades. And although income increases for the most part too, it’s not nearly at the same rate.
These circumstances make it difficult for buyers to anticipate when they can buy a home with confidence. Still, it’s a good reminder that every market is different, and the best time to buy in one place may be the best time to sell in another.
Methodology
We sourced median income data from the US Census Bureau and adjusted to 2018 dollars. Median home price came from DQYDJ.com. Their analysis used home prices from the National Association of Realtors, the Federal Housing Finance Agency, Robert Shiller, and the US Bureau of Labor Statistics.
Sources
- US Census Bureau, “Historical Income Tables”
- US Census Bureau, “Table H-6 Footnotes"
- DQYDJ, “Historical Home Prices”