The Least and Most Affordable Big Cities for Minimum Wage Earners 2022

Joe Roberts
Aug 05, 2022
Icon Time To Read3 min read

Minimum wage is a hot-button issue these days. Everyone from politicians to podcast hosts is fiercely debating the subject—and with good reason. The US hasn’t raised its minimum wage since 2009 when it was set at $7.25.[1] Meanwhile, living costs across the country have only gone up. The result is that the federal minimum wage is no longer livable in many places.

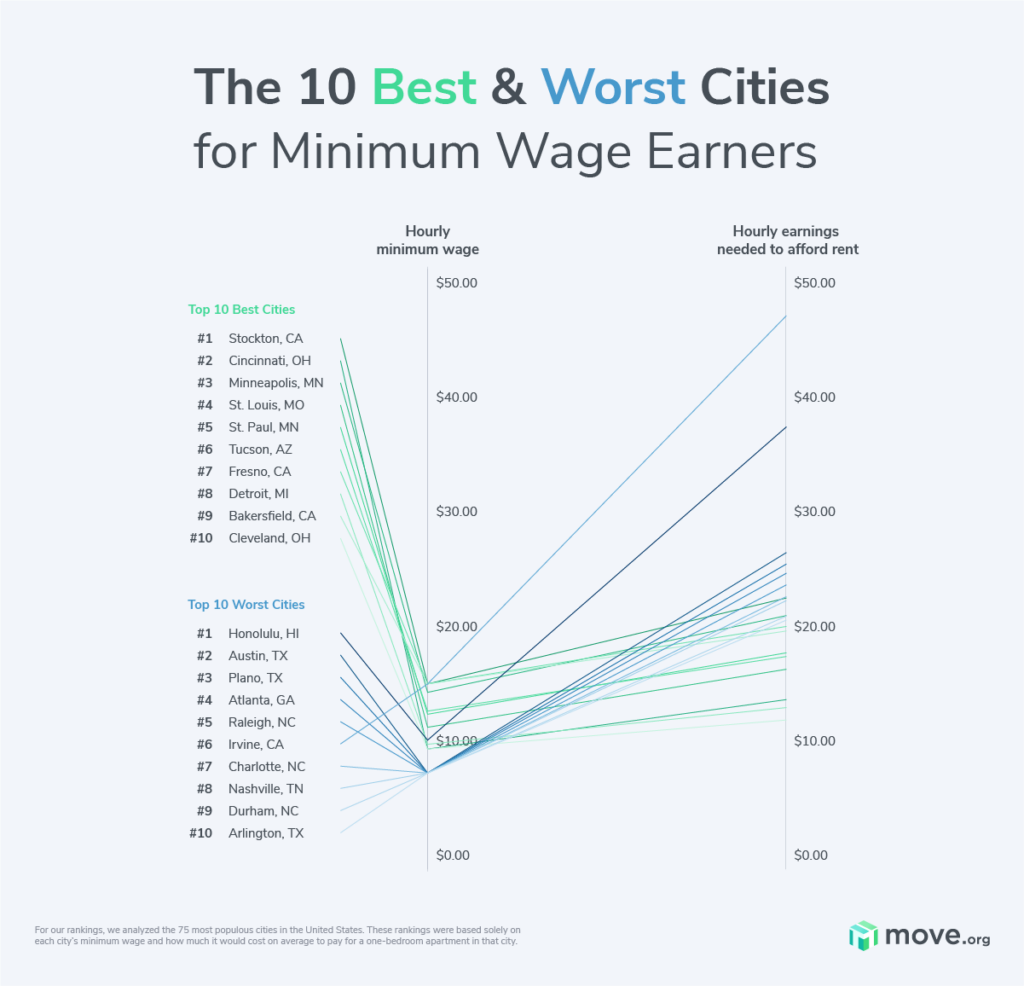
Luckily, some cities and states have set their own minimum wages to try to solve this problem, some with more success than others. To find out which US cities are the most affordable  for people who make minimum wage, we compared the average rent in the US’s most populous cities to the minimum wage in those cities.

We found that the federal minimum wage just doesn’t cut it in most places. In the least livable cities, you’d have to work close to 200 hours every month while making minimum wage just to pay rent—let alone buy groceries, save up for a house, or afford hobbies. Luckily, the situation isn’t that bleak everywhere.

Whether you’re looking for an affordable place to move to or you’re just trying to get informed before you debate your uncle at the next family gathering, our analysis provides all the information you need.

Graph comparing city's minimum and hourly earnings needed in order to afford rent in the city.

Key findings

  • Minimum wage is higher than $7.25 in all of the 10 best cities for minimum wage earners. No city with a $7.25 minimum wage was determined livable.
  • Despite its high minimum wage, Honolulu is the least livable city for minimum wage earners. You would have to work 24 eight-hour shifts (192 hours) in a month to make enough money for rent.
  • Cleveland, Ohio, is the most affordable large city in the country for minimum-wage earners. The city’s minimum wage is set at $9.30 while its average monthly rent is only $619.50.
  • Even in cities where minimum wage could cover rent, most apartment communities wouldn’t accept someone making that city’s minimum wage as a tenant.
  • Many cities have traded places in our rankings since last year’s analysis. This is at least partially due to shifts in rental rates across the country.
  • Only one California city (Irvine) is among the least liveable cities for minimum-wage earners. Rent in many California cities is higher than the rest of the country, but California’s minimum wage is much higher than the federal minimum. Additionally, some California cities have set their own minimum wages to keep up with living costs.
  • Three California cities (Bakersfield, Fresno, and Stockton) were among the best cities for minimum-wage earners.
Pin
Looking for a job in a new city?

If you’re planning to move to a new city but want to switch careers or find a new job before you do, you need to prepare in advance. Here are a few helpful tips to help you find work before or soon after you move to your new location.

Ready to move?

Company
Company type
Move.org rating
Packing & loading services
Pricing
Discounts
Learn more
Professional mover
4.8 out of 5 stars
4.8
Icon Yes  LightYes
$$$
Icon Yes  Light10% Move.org discount, military personnel, seniors
Professional mover
4.5 out of 5 stars
4.5
Icon Yes  LightYes
$$$
Icon No  LightNone
Professional mover
4.8 out of 5 stars
4.8
Icon Yes  LightYes
$$$
Icon Yes  LightSeniors
Moving container company
4.6 out of 5 stars
4.6
Icon No  LightNo
$$
Icon Yes  Light10% Move.org discount, military personnel
Moving container company
4.5 out of 5 stars
4.5
Icon No  LightNo
$$
Icon Yes  LightMove.org readers, military personnel

Methodology

For our rankings, we analyzed the 75 most populous cities in the United States according to the US Census Bureau.[1] Our rankings were based solely on each city’s minimum wage and how much it would cost on average to rent a one-bedroom apartment in that city. We pulled our rent data from Apartment List.[2] For each city’s minimum wage, we pulled numbers from The Economic Policy Institute.[3]

Additional expenses like food, utilities, insurance, entertainment, and transportation had no impact on our rankings. We also didn’t include crime statistics, unemployment rates, access to government services, or other quality of life factors in our methodology.

Several cities have minimum wages that vary based on business size. For this list, we focused on larger businesses, so if a city had a minimum wage of $8 for businesses of 50 employees or fewer and a minimum wage of $10 for all other businesses, we used the $10 minimum wage for our rankings.

Additionally, since apartment communities often only accept tenants whose annual income is equal to 40 times their monthly rent,[4] we also calculated how much people need to make annually in order to get a lease. We then calculated the hourly earnings required for acceptance from that annual income.


The worst cities for minimum wage earners

Rank
City
State
Population
Average rent for a one-bedroom apartment
Hourly minimum wage
Monthly hours worked at pre-tax minimum wage to afford rent
Hourly earnings required for acceptance into apartment communities
1Urban HonoluluHawaii345,055$1,948.00$10.10192.87$37.46
2AustinTexas979,263$1,377.50$7.25190.00$26.49
3PlanoTexas285,849$1,321.50$7.25182.28$25.41
4AtlantaGeorgia506,804$1,293.00$7.25178.34$24.87
5RaleighNorth Carolina474,708$1,229.50$7.25169.59$23.64
6IrvineCalifornia287,387$2,452.50$15.00163.50$47.16
7CharlotteNorth Carolina885,707$1,174.00$7.25161.93$22.58
8Nashville-DavidsonTennessee668,580$1,162.50$7.25160.34$22.36
9DurhamNorth Carolina279,447$1,093.00$7.25150.76$21.02
10ArlingtonTexas398,860$1,073.00$7.25148.00$20.63

The best cities for minimum wage earners

Rank
City
State
Population
Average rent for a one-bedroom apartment
Hourly minimum wage
Monthly hours worked at pre-tax minimum wage to afford rent
Hourly earnings required for acceptance into apartment communities
1ClevelandOhio380,989$619.50$9.3066.61$11.91
2BakersfieldCalifornia384,159$1,031.00$15.0068.73$19.83
3DetroitMichigan670,052$678.50$9.8768.74$13.05
4FresnoCalifornia531,581$1,041.50$15.0069.43$20.03
5TucsonArizona548,082$910.50$12.8071.13$17.51
6St. PaulMinnesota308,096$918.00$12.5073.44$17.65
7St. LouisMissouri300,576$842.00$11.1575.52$16.19
8MinneapolisMinnesota429,605$1,095.50$14.2576.88$21.07
9CincinnatiOhio303,954$715.00$9.3076.88$13.75
10StocktonCalifornia312,682$1,170.00$15.0078.00$20.63

Sources

  1. Paycor,  “Minimum Wage by State and 2022 Increases,” November 29, 2021. Accessed March 8, 2022.
  2. United States Census Bureau, “Total Population.” Accessed March 3, 2022.
  3. Apartment List, “Data & Rent Estimates.” Accessed March 3, 2022.
  4. The Economic Policy Institute, “Minimum Wage Tracker,” January 1, 2022. Accessed March 3, 2022.
  5. ForRent.com, “How Much Rent Can I Afford?” Accessed March 3, 2022.

Minimum wage livability by city

Rank
City
State
Population
Average rent for a one-bedroom apartment
Hourly minimum wage
Monthly hours worked at pre-tax minimum wage to afford rent
1Urban Honolulu CDP Hawaii345,055$1,948.00$10.10192.9
2AustinTexas979,263$1,377.50$7.25190.0
3Plano Texas285,849$1,321.50$7.25182.3
4AtlantaGeorgia506,804$1,293.00$7.25178.3
5RaleighNorth Carolina474,708$1,229.50$7.25169.6
6IrvineCalifornia287,387$2,452.50$15.00163.5
7CharlotteNorth Carolina885,707$1,174.00$7.25161.9
8Nashville-DavidsonTennessee668,580$1,162.50$7.25160.3
9DurhamNorth Carolina279,447$1,093.00$7.25150.8
10ArlingtonTexas398,860$1,073.00$7.25148.0
11DallasTexas1,343,565$1,066.00$7.25147.0
12PhiladelphiaPennsylvania1,584,064$1,054.50$7.25145.4
13Fort WorthTexas913,656$1,038.00$7.25143.2
14San FranciscoCalifornia881,549$2,287.50$16.32140.2
15MiamiFlorida467,968$1,398.00$10.00139.8
16BostonMassachusetts694,295$1,951.00$14.25136.9
17Corpus ChristiTexas326,590$986.50$7.25136.1
18HendersonNevada320,190$1,304.00$9.75133.7
19San AntonioTexas1,547,250$966.00$7.25133.2
20PittsburghPennsylvania300,281$961.50$7.25132.6
21HoustonTexas2,316,797$959.00$7.25132.3
22GreensboroNorth Carolina296,725$954.50$7.25131.7
23New OrleansLouisiana390,144$954.00$7.25131.6
24OrlandoFlorida287,435$1,291.50$10.00129.2
25TampaFlorida399,690$1,291.00$10.00129.1
26MemphisTennessee651,088$924.50$7.25127.5
27Virginia BeachVirginia449,974$1,398.00$11.00127.1
28Oklahoma CityOklahoma655,158$905.00$7.25124.8
29New York CityNew York8,336,817$1,807.50$15.00120.5
30Lexington-Fayette urban countyKentucky323,152$871.00$7.25120.1
31IndianapolisIndiana870,340$849.00$7.25117.1
32El PasoTexas681,729$843.50$7.25116.3
33San JoseCalifornia1,021,786$1,856.00$16.20114.6
34WashingtonDistrict of Columbia705,749$1,718.50$15.20113.1
35San DiegoCalifornia1,423,852$1,694.50$15.00113.0
36Louisville/Jefferson CountyKentucky617,630$818.50$7.25112.9
37JacksonvilleFlorida911,528$1,092.50$10.00109.3
38MilwaukeeWisconsin590,157$784.50$7.25108.2
39Las VegasNevada651,297$1,053.00$9.75108.0
40OaklandCalifornia433,044$1,625.50$15.06107.9
41AnaheimCalifornia350,351$1,608.50$15.00107.2
42TulsaOklahoma401,760$775.50$7.25107.0
43Los AngelesCalifornia3,979,537$1,590.50$15.00106.0
44RiversideCalifornia331,369$1,561.00$15.00104.1
45NewarkNew Jersey281,999$1,336.50$13.00102.8
46ColumbusOhio902,073$956.00$9.30102.8
47AuroraColorado379,312$1,285.00$12.56102.3
48Anchorage Alaska288,000$1,047.00$10.34101.3
49Santa AnaCalifornia332,332$1,512.50$15.00100.8
50Chula VistaCalifornia274,485$1,496.50$15.0099.8
51MesaArizona517,981$1,262.50$12.8098.6
52OmahaNebraska478,203$877.50$9.0097.5
53Long BeachCalifornia462,645$1,452.00$15.0096.8
54SeattleWashington753,655$1,620.50$17.2793.8
55WichitaKansas389,914$678.00$7.2593.5
56PortlandOregon653,467$1,176.50$12.7592.3
57LincolnNebraska289,096$818.50$9.0090.9
58Colorado SpringsColorado478,215$1,117.50$12.5689.0
59DenverColorado727,211$1,410.00$15.8788.8
60SacramentoCalifornia513,620$1,313.00$15.0087.5
61PhoenixArizona1,680,988$1,087.50$12.8085.0
62BaltimoreMaryland593,490$1,053.50$12.5084.3
63ChicagoIllinois2,693,959$1,254.00$15.0083.6
64AlbuquerqueNew Mexico560,504$935.00$11.5081.3
65Kansas CityMissouri495,278$873.00$11.1578.3
66StocktonCalifornia312,682$1,170.00$15.0078.0
67CincinnatiOhio303,954$715.00$9.3076.9
68MinneapolisMinnesota429,605$1,095.50$14.2576.9
69St. LouisMissouri300,576$842.00$11.1575.5
70St. PaulMinnesota308,096$918.00$12.5073.4
71TucsonArizona548,082$910.50$12.8071.1
72FresnoCalifornia531,581$1,041.50$15.0069.4
73DetroitMichigan670,052$678.50$9.8768.7
74BakersfieldCalifornia384,159$1,031.00$15.0068.7
75ClevelandOhio380,989$619.50$9.3066.6
Joe Roberts
Written by
Joe Roberts
Joe Roberts is a professional writer with a degree in writing studies and over four years of copywriting experience. He previously worked at Overstock.com, where he wrote about furniture, home decor, and moving. Joe has moved all over Utah, so he knows his way around a moving truck—and he spends his time (and money) expanding his personal library so it will be even heavier next time he moves.